B2B Marketing to Associations: SEO and AI Visibility Benchmark Report
Highlights
We analyzed the SEO and AI visibility data of selected ASAE exhibitors to see how businesses selling to associations are performing in traditional and AI search. Here are our findings which association vendors can benchmark against:
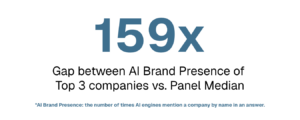
- AI visibility is extremely concentrated. The top 3 in the panel average 159x more AI mentions than a typical company. The typical company is virtually invisible to the modern buyer who shortlists vendors through AI engines.
- Most brands show up on AI Overviews only. 83% of all AI mentions come from Google’s AI Overviews alone, while ChatGPT (10.5%), Perplexity (10.5%), and Gemini (19.3%) barely register.
- Mention volume and mention quality are separate levers a CMO can utilize. Volume of AI mentions only weakly predicts how well a company ranks when mentioned. If you can’t beat the category leader’s volume, you can still win by achieving higher rankings on the prompts that your buyers actually use.
- Organic search is a steep long tail. The top 3 companies capture 79% of all organic traffic in the sector — roughly 244x a typical vendor’s traffic. Winning specific, high-relevance search terms is a more realistic path than chasing overall traffic share.
- Domain authority is close to a precondition for AI visibility. Domain Trust correlates with AI Brand Presence at 0.70, and Organic Keywords with AI Link Presence at 0.88 — the strongest relationship in the dataset. SEO fundamentals (authority-building, keyword footprint) are still the best foundation for AI visibility.
- 90% of companies are either strong on both organic and AI visibility, or weak on both. Stop debating “SEO vs. AI visibility” prioritization — they move together, so investment in one is investment in both.
- 40.9% of the panel runs HubSpot, and HubSpot users in the panel showed better overall visibility metrics.
About the panel
- Panel size: 142 companies randomly drawn from the 2026 ASAE Annual Meeting & Exposition exhibitor list. For organic search and AI visibility, data was collected on a subsample of 57 companies that passed data-quality screening.
- Exclusions: broad-reach, horizontal vendors who serve many industries and do not treat the association sector as a core, distinct buyer
- Data sources: SE Ranking (organic SEO metrics and AI/GEO visibility across ChatGPT, Perplexity, Gemini, AI Mode, and AI Overviews), Google PageSpeed Insights (site performance and Core Web Vitals), and martech signals (CMS, marketing automation, analytics).
- Segmentation: every company was sorted into one of five categories:
- Association Technology Platforms – AMS/CRM, online community, governance/voting, and membership-engagement software built for associations
- Events and Meetings Tech and Services – event and meeting management tools, event apps, AV/production, and other event-lifecycle tools and services
- Learning and Certification Technologies – LMS, continuing-education, credentialing/certification, and digital-content platforms
- Marketing, Media & Creative – Branding, digital marketing, design, PR, and association-focused media/publishing services and agencies
- Professional & Advisory Services – Association management companies (AMCs), management/program/IT consulting, and accounting, HR, and insurance firms serving associations
Research Findings | AI Visibility
1. Only A Small Group of Companies Dominate AI Search Visibility
On average, the top 3 companies in the entire panel have 159x more AI Brand Presence than the typical company in this sector. This translates to 90% of all measured AI Brand Presence being concentrated in the top 10 most visible companies.
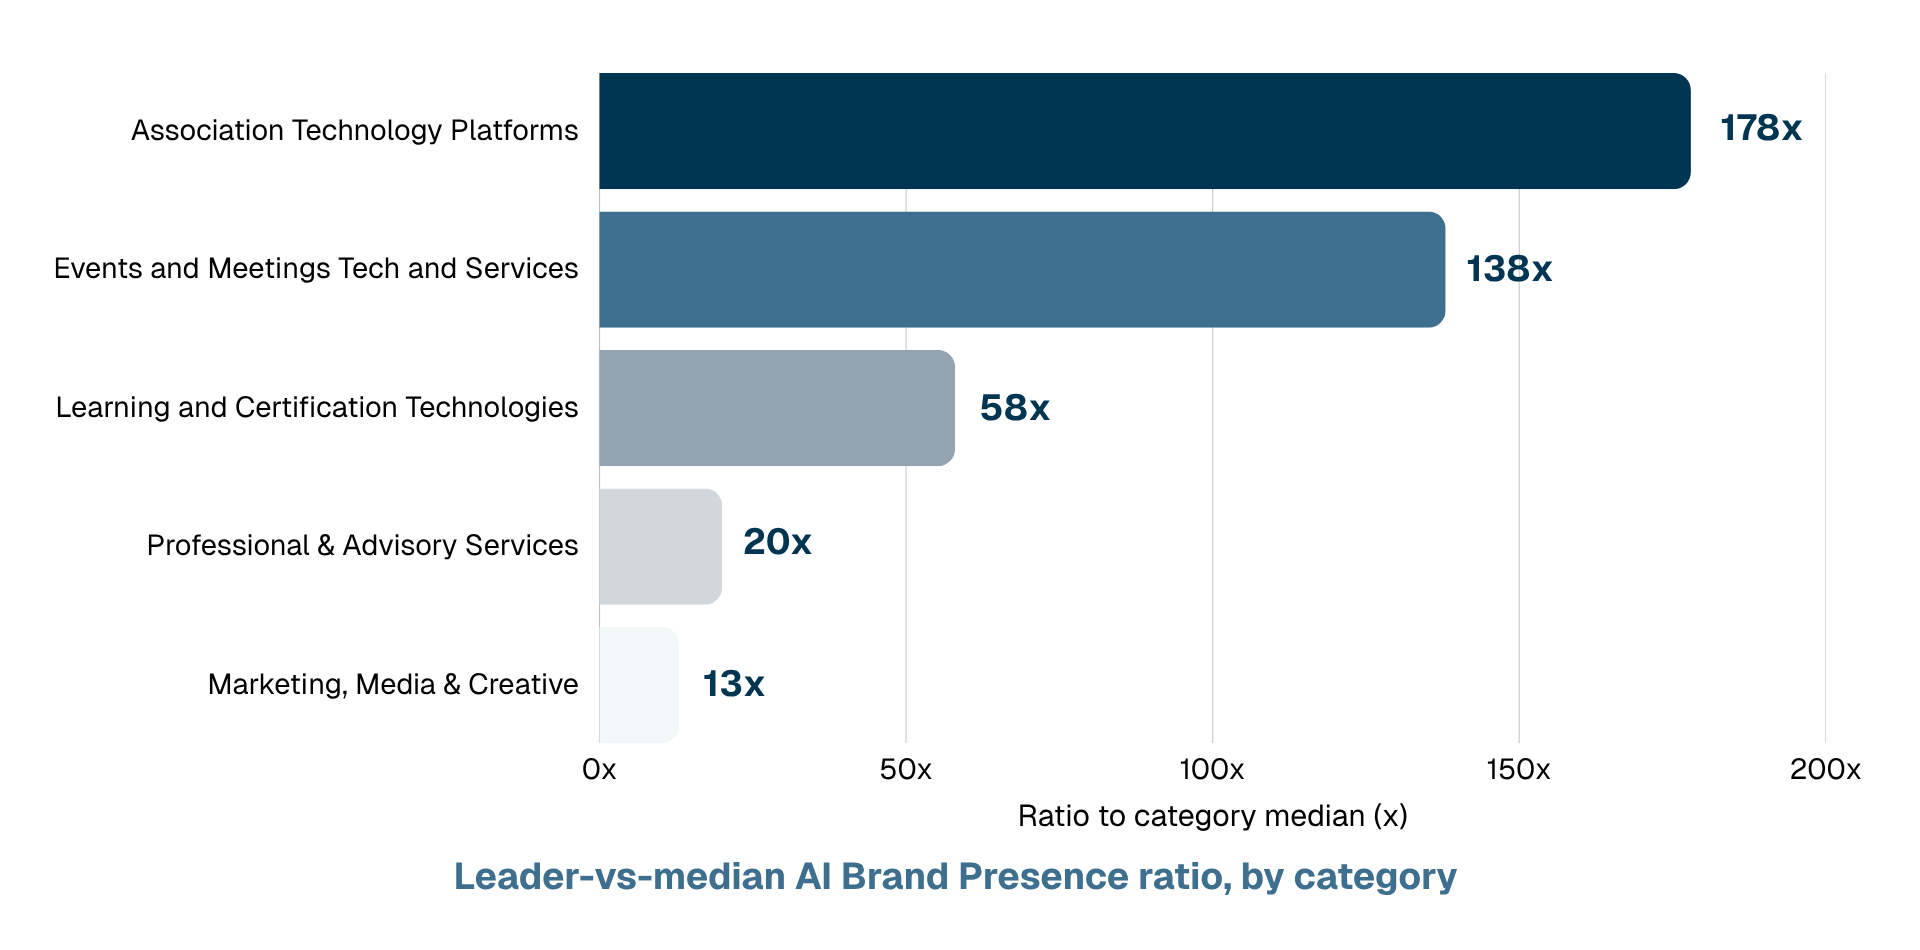
This concentration is also evident in each of the five categories tracked. In Association Technology Platforms, the category leader outpaces the typical company’s AI Brand Presence by 178x. In Events and Meetings Tech and Services, the leading company is ahead by 138x. In Learning and Certification Technologies, the gap is 58x; in Professional & Advisory Services, 20x. Even the most evenly distributed category — Marketing, Media & Creative — still shows its leader running 13x ahead of the typical company’s AI Brand Presence, represented by the category median.
What this concentration means: Every company in this panel has made a real investment in visibility by exhibiting at ASAE, the sector’s single largest gathering of buyers in one place. That’s genuine, valuable visibility, and it reaches buyers at exactly the moment they’re evaluating vendors in person. However, you also want to be the brand that shows up when those same association buyers are back at their desks, asking an AI engine for a shortlist.
For most association-sector vendors, that second channel is already being won by a small handful of competitors, with most brands failing to capitalize on this channel.
2. Most brands appear only in Google AI Overviews and barely anywhere else.
83% of all AI mentions across the panel came from a single source: Google’s AI Overviews. Company-level reach tells the same story — almost all companies appear somewhere in AI Overviews, but only around half (53%) show up in Google’s AI Mode.
The other three major AI engines barely register. ChatGPT surfaces only 10.5% of companies in the panel. Perplexity: 10.5%. Gemini: 19.3%. Brands in this sector are literally invisible on AI search engines where modern buyers are doing their vendor research.
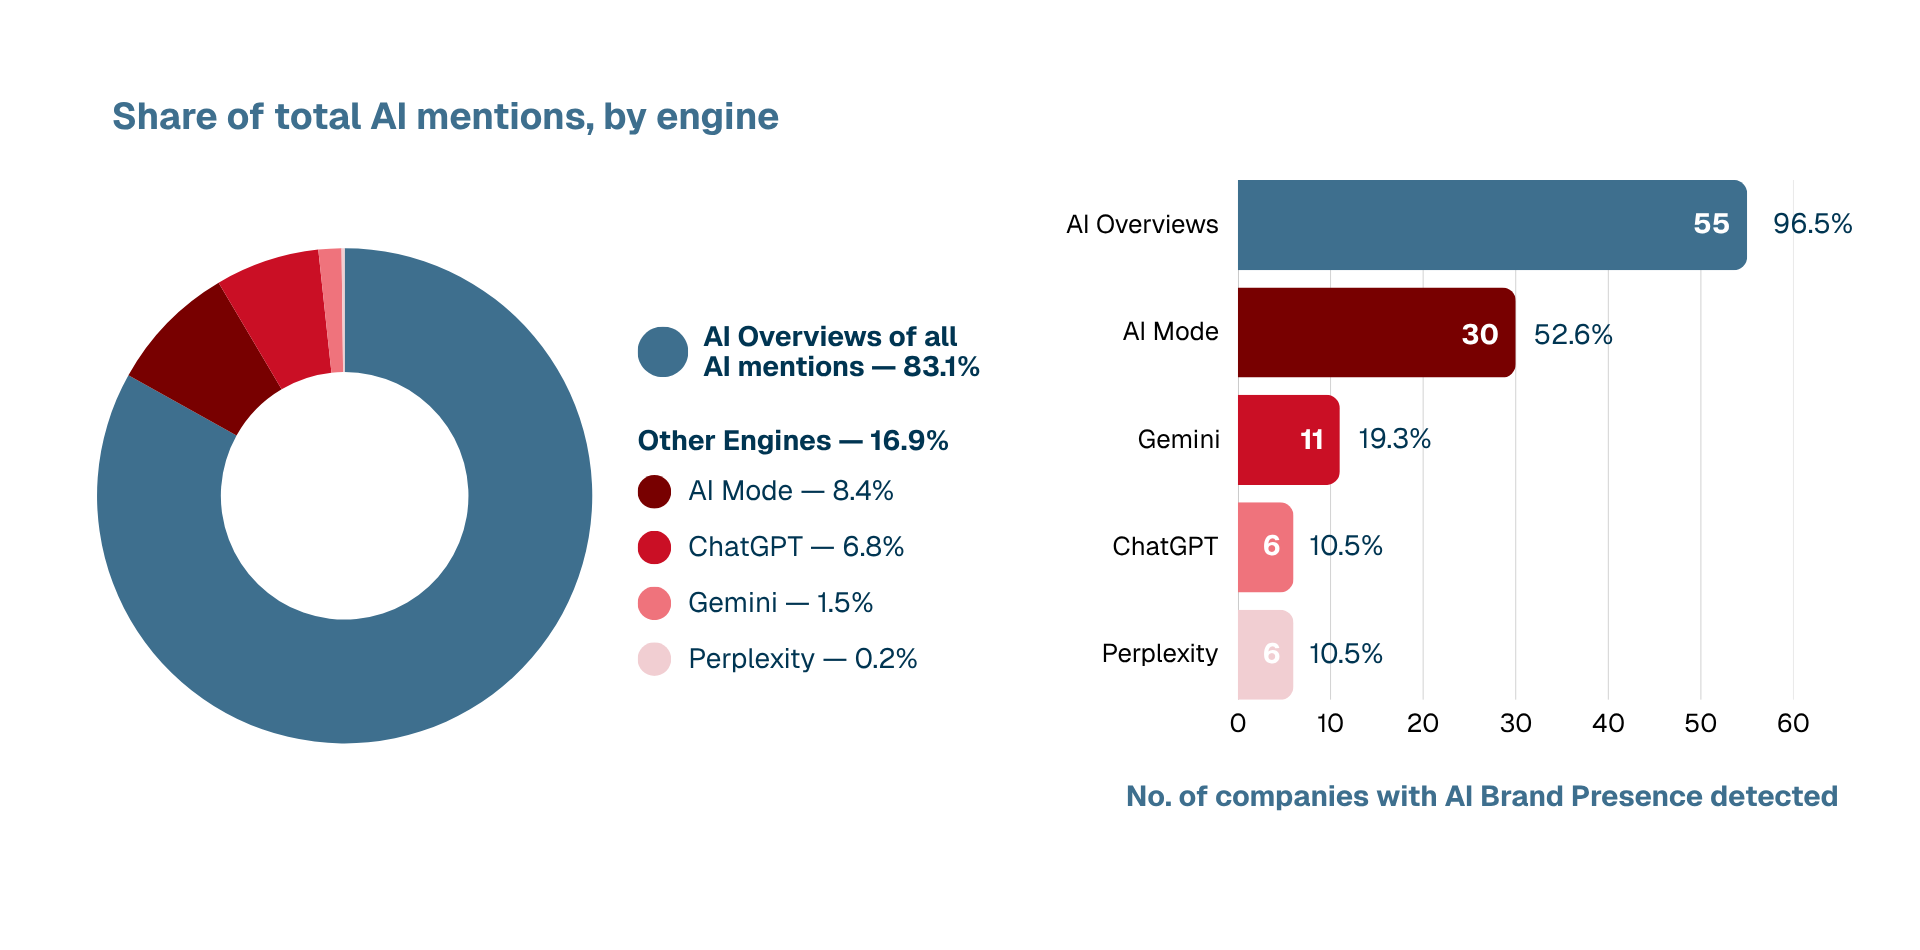
The data makes clear that appearing on AI Overviews doesn’t guarantee appearing on all AI engines. This complexity emphasizes how important it is for B2B marketers to have a dashboard that actively tracks and measures their AI visibility across the AI engines that matter to them.
CMO TIP The first step to AI visibility strategy – establish your baseline visibility. Monitor the prompts that are most significant to your bottom line, and know where you stand vs your competitors.
The complexity of AI search visibility also highlights the need for brands to have a sharp strategy. “Spray and pray” volume-focused tactics will not work, and may even cost you in the long run. A sharp AI visibility strategy makes sure a brand shows up on the right platform, the right prompts, and the right buyer.
CMO TIP Find out where your actual buyers search for vendor shortlists. Do they ask ChatGPT? Google’s AI Overview? Claude? Gemini? Visibility doesn’t transfer evenly across engines, so this determines where your effort should go first.
3. Being Mentioned a Lot and Being Mentioned Well Are Two Different Games
Panel-wide, mention volume and position quality correlate only weakly (a Spearman correlation of −0.32). That means that having a higher volume of mentions on AI engines only modestly predicts a better position.
Splitting the panel at its own medians for AI Brand Presence (mention volume) and AI Average Position (how highly a company is ranked when an AI engine does mention it), we can see that the panel is generally spread out across all quadrants.
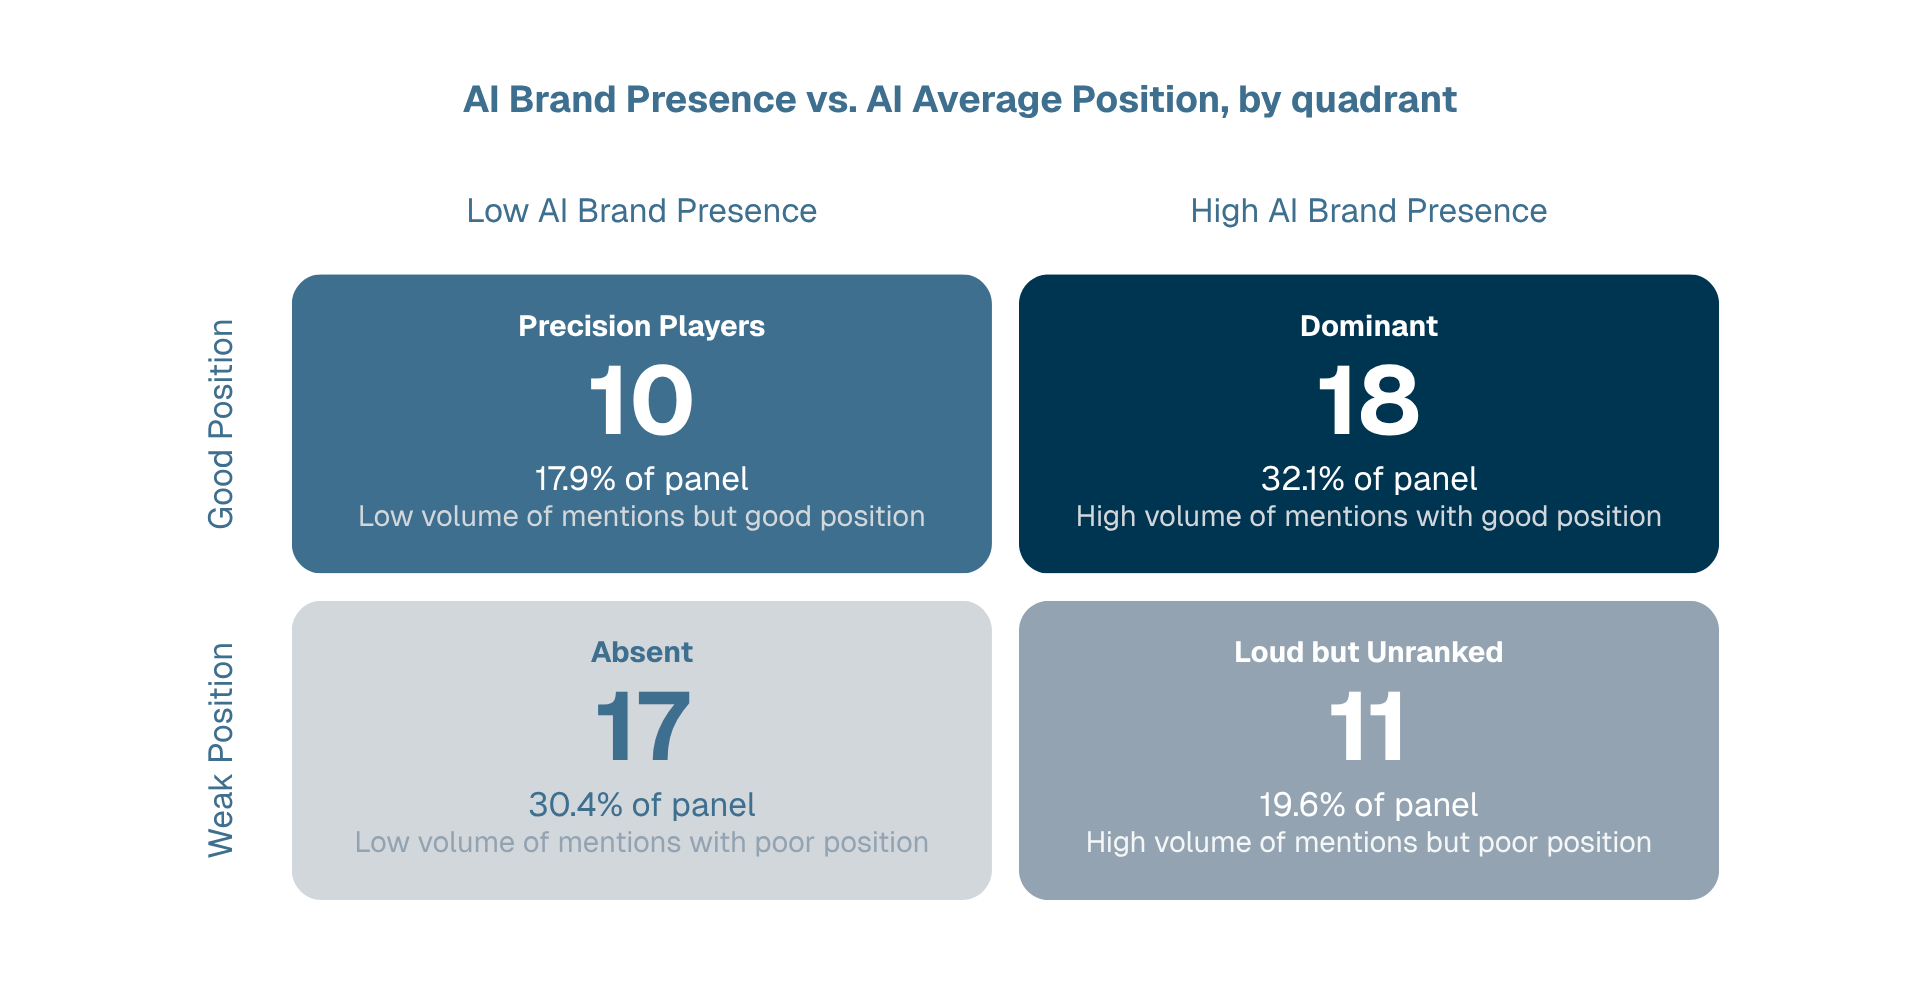
About a third of companies (32%, Dominant quadrant) possess a high volume of mentions and strong position, demonstrating genuine category leadership. Interestingly enough, a good 20% of the panel are “Loud but Unranked”, with a high mention volume, but a weak position when they do appear. The last quadrant representing 18% are “Precision Players”. These companies have comparatively low mention volume, but a genuinely strong position when they are cited.
This finding illustrates how volume and quality of citation are separate levers a CMO can pull independently. A brand can achieve a strong position even without the volume and scale of the category leader.
CMO TIP A company that can’t out-produce the category leader in sheer mention count still has a real, data-backed path to winning on position quality instead. The practical implication is a smart targeting strategy vs a volume-focused strategy. Rather than spreading effort across as many prompts as possible, the smarter move is identifying the specific handful of high-intent queries your actual buyers are likely asking, and building focused, well-structured content and entity signals around exactly those.
Research Findings | Organic Search
1. A Handful of Companies Own Association-Sector Organic Search
The top 3 companies in the panel hold 79% of all organic traffic measured across the sector. This translates to the average monthly traffic of the top 3 companies being roughly 244x that of a typical company trying to reach associations.
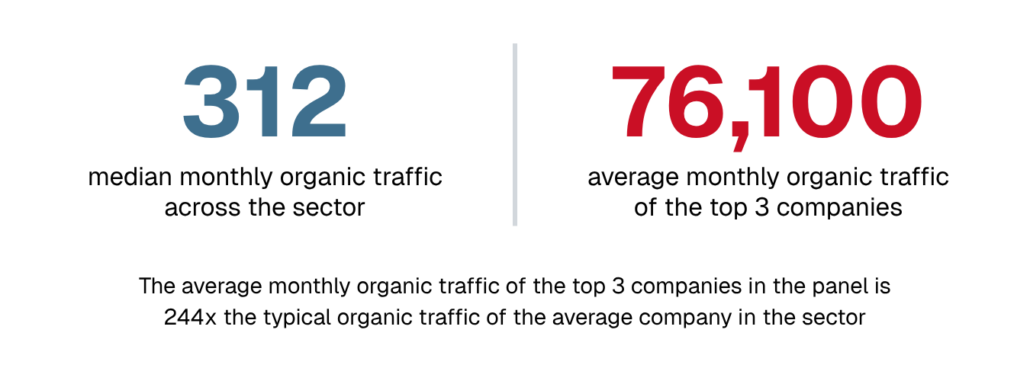
While part of this large gap may be attributed to some ASAE exhibitors serving multiple sectors (associations, nonprofits, higher-ed, to name a few), these numbers still surface a real gap in visibility which puts the typical association vendor at a disadvantage.
There is much room to grow in organic visibility for the typical association vendor, but the competition is high. A SaaS or service company who wishes to reach associations needs a sharp strategy to ensure visibility, recognition, and credibility to its target buyers.
What this means for your brand: For a relatively smaller player, this means showing up for the right search terms (for traditional search) and the right prompts (for AI search) that your buyers type when doing vendor research. Similar to the “Precision Player” strategy mentioned above, winning on volume is not the only way to win against your competitors.
2. Domain Authority is One of the Strongest Predictors of Organic Traffic
Domain Trust, a 0–100 measure of a website’s overall authority, was found to be a strong predictor of organic traffic based on this dataset (a Spearman correlation of 0.68). Splitting the panel at its own medians for authority and traffic makes this concrete: 40% of companies are “Authority Backed by Traffic” — high on both — and 35% are “Low Authority, Low Traffic” — low on both. Together, three-quarters of the panel shows the two moving in lockstep. This illustrates how building authority is one of the best things you can do to build traffic to your site.
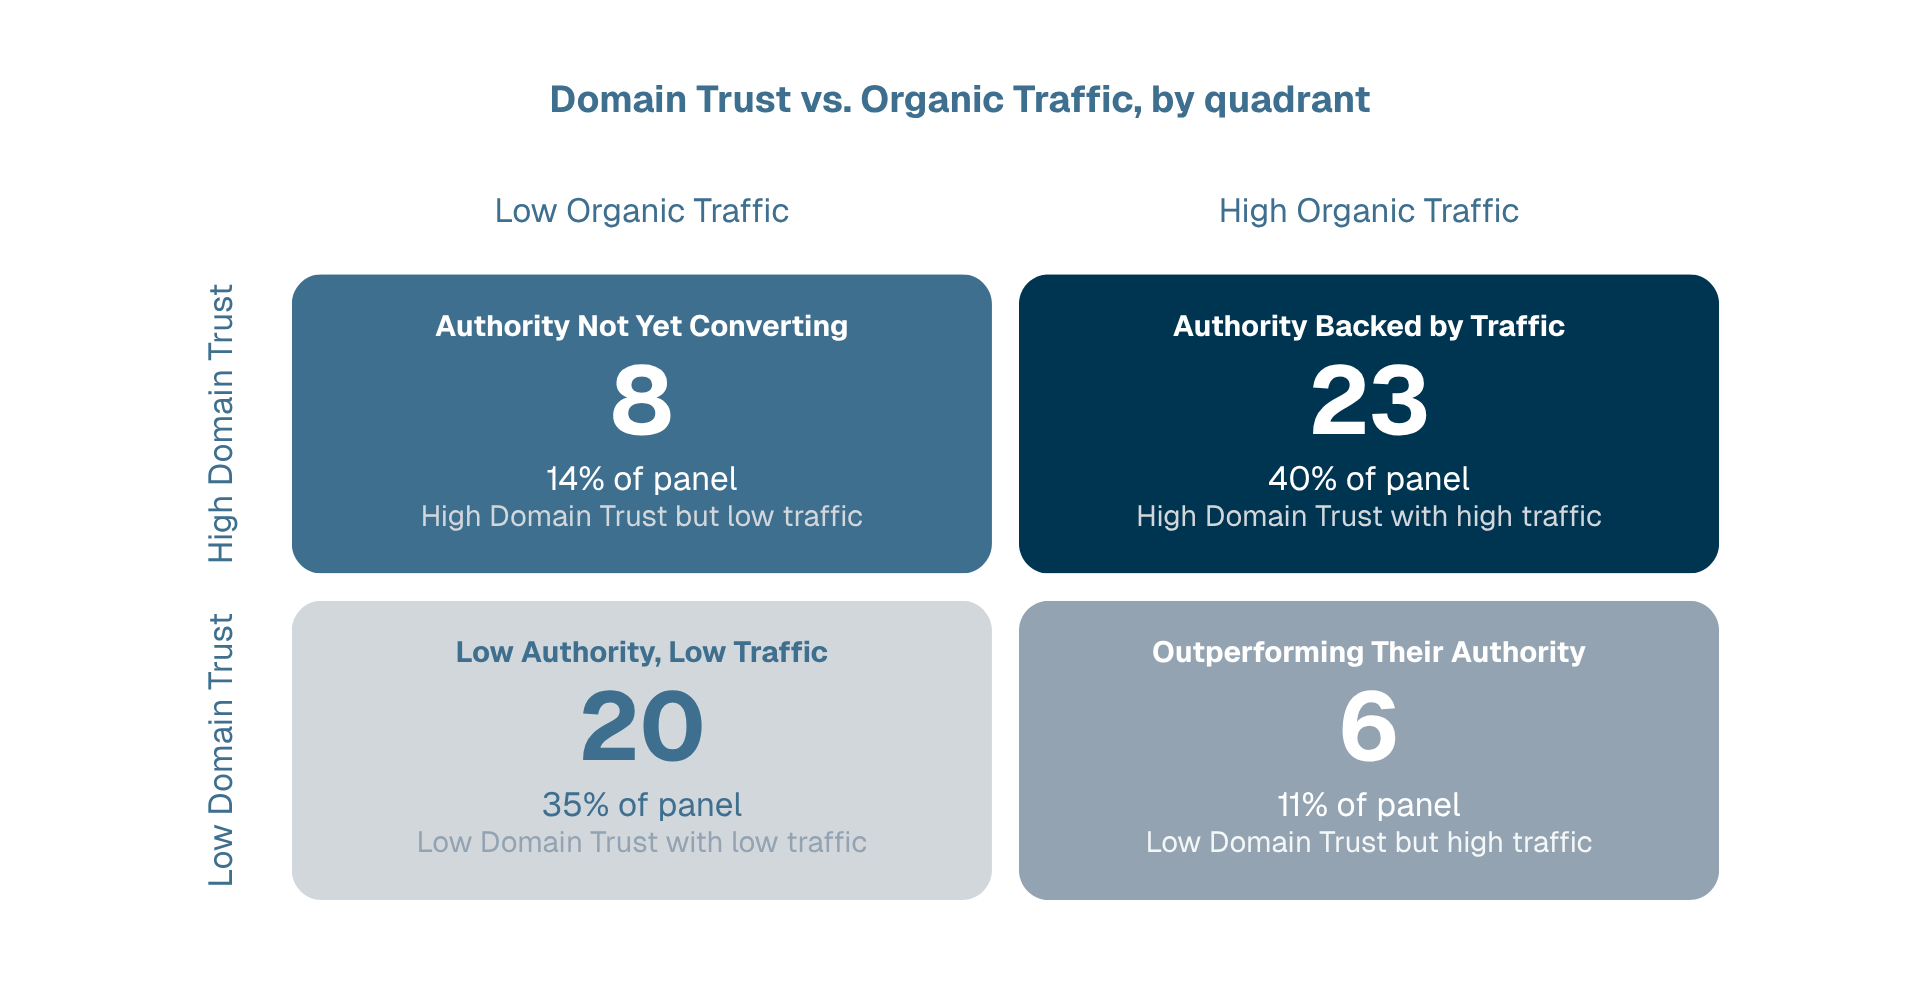
The remaining quarter splits in an interesting way. 11% of companies are “Outperforming Their Authority” — getting real organic traffic despite below-median Domain Trust, proof that authority isn’t strictly destiny. A smaller 14% sit at “Authority Not Yet Converting” — real authority that hasn’t yet translated into traffic.
3. Domain Authority Is Similar Across Most of the Sector, With a Real Gap at the Bottom
Median Domain Trust (scored from 0-100) sits at 72 across the panel, with the middle 50% of companies packed into a tight band between 66 and 79. This implies that most vendors in this sector are operating on a similar authority footing. If your Domain Trust sits well below 66, you’re already performing worse than most of your peers in this sector.
At the very bottom of the distribution, a real gap opens up: 17.5% of the panel (10 of 57 companies) score below 60 on Domain Trust, well outside the tight 66–79 band the rest of the sector occupies. As a group, these companies underperform the panel median substantially on several metrics. These companies land at only 57% of the panel’s typical organic traffic, 49% of its typical keyword footprint, and just 22% of its typical AI Brand Presence. There are a few exceptions, but as a group, the pattern exists.
Action point: If your Domain Trust is below 60, it’s worth reviewing your organic traffic and AI visibility performance based on our Category Benchmarks table below, to see if you’re severely underperforming compared to your peers.
| Category | Median Domain Trust | Median Organic Traffic per month | Median Combined AI Presence (Brand Presence + Link Presence) |
|---|---|---|---|
| Association Technology Platforms | 75 | 288 | 129 |
| Events and Meetings Tech and Services | 76 | 375 | 32 |
| Learning and Certification Technologies | 74 | 243 | 132 |
| Marketing, Media & Creative | 72 | 312 | 95 |
| Professional & Advisory Services | 68 | 405 | 86 |
4. Organic search performance plays a big role in AI Visibility success.
Panel data showed that Domain Trust correlates with AI Brand Presence at 0.70. This means that companies with stronger organic authority tend to also show up more often in AI answers. Similarly, Organic Keywords correlates with AI Link Presence at 0.88, the strongest relationship measured anywhere in this dataset. This implies that companies with a broader keyword footprint get pulled in as an AI-cited source far more often.
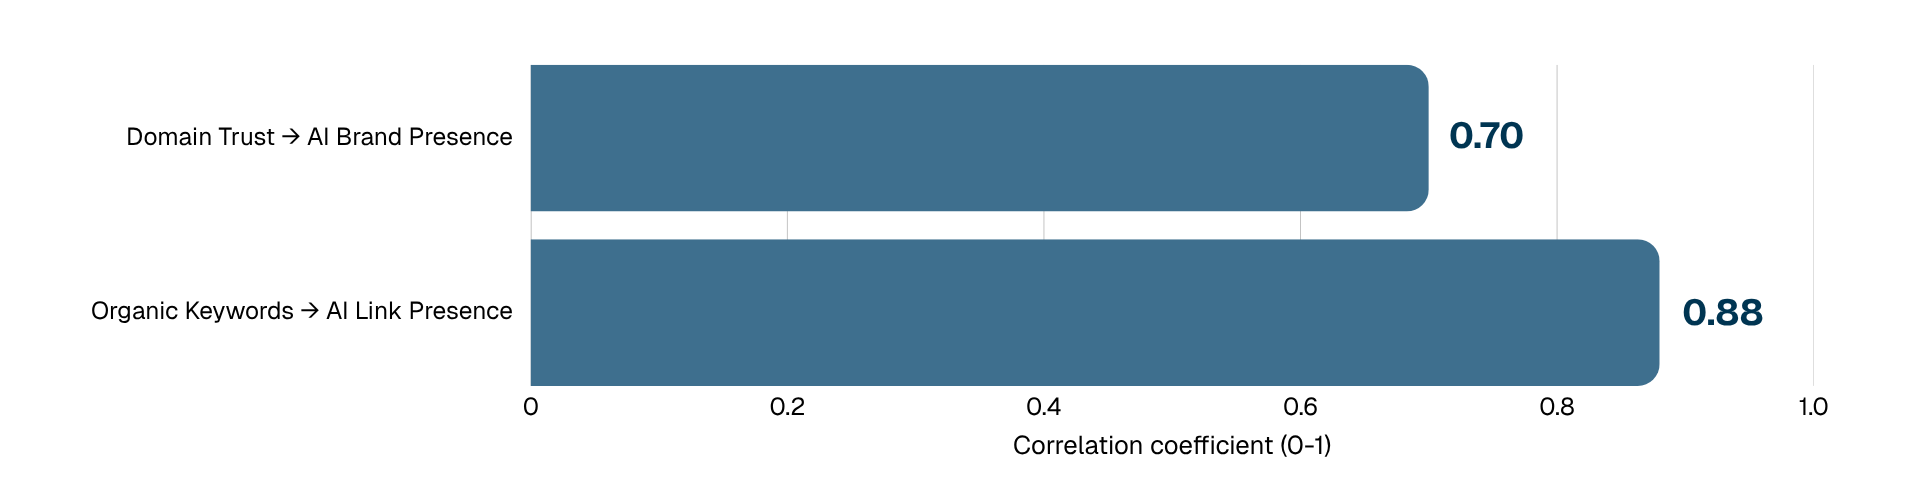
This is one of the strongest findings in this report. A strong organic foundation looks like the closest thing to a precondition for AI visibility in this data, not a separate, independently winnable channel. The question isn’t whether to invest in SEO or in AI visibility — panel data shows that SEO substantially builds AI visibility.
Research Findings | Site Health and Conversion Readiness
1. More Than Half the Panel Is Running a “Poor” Site by Google’s Own Standard
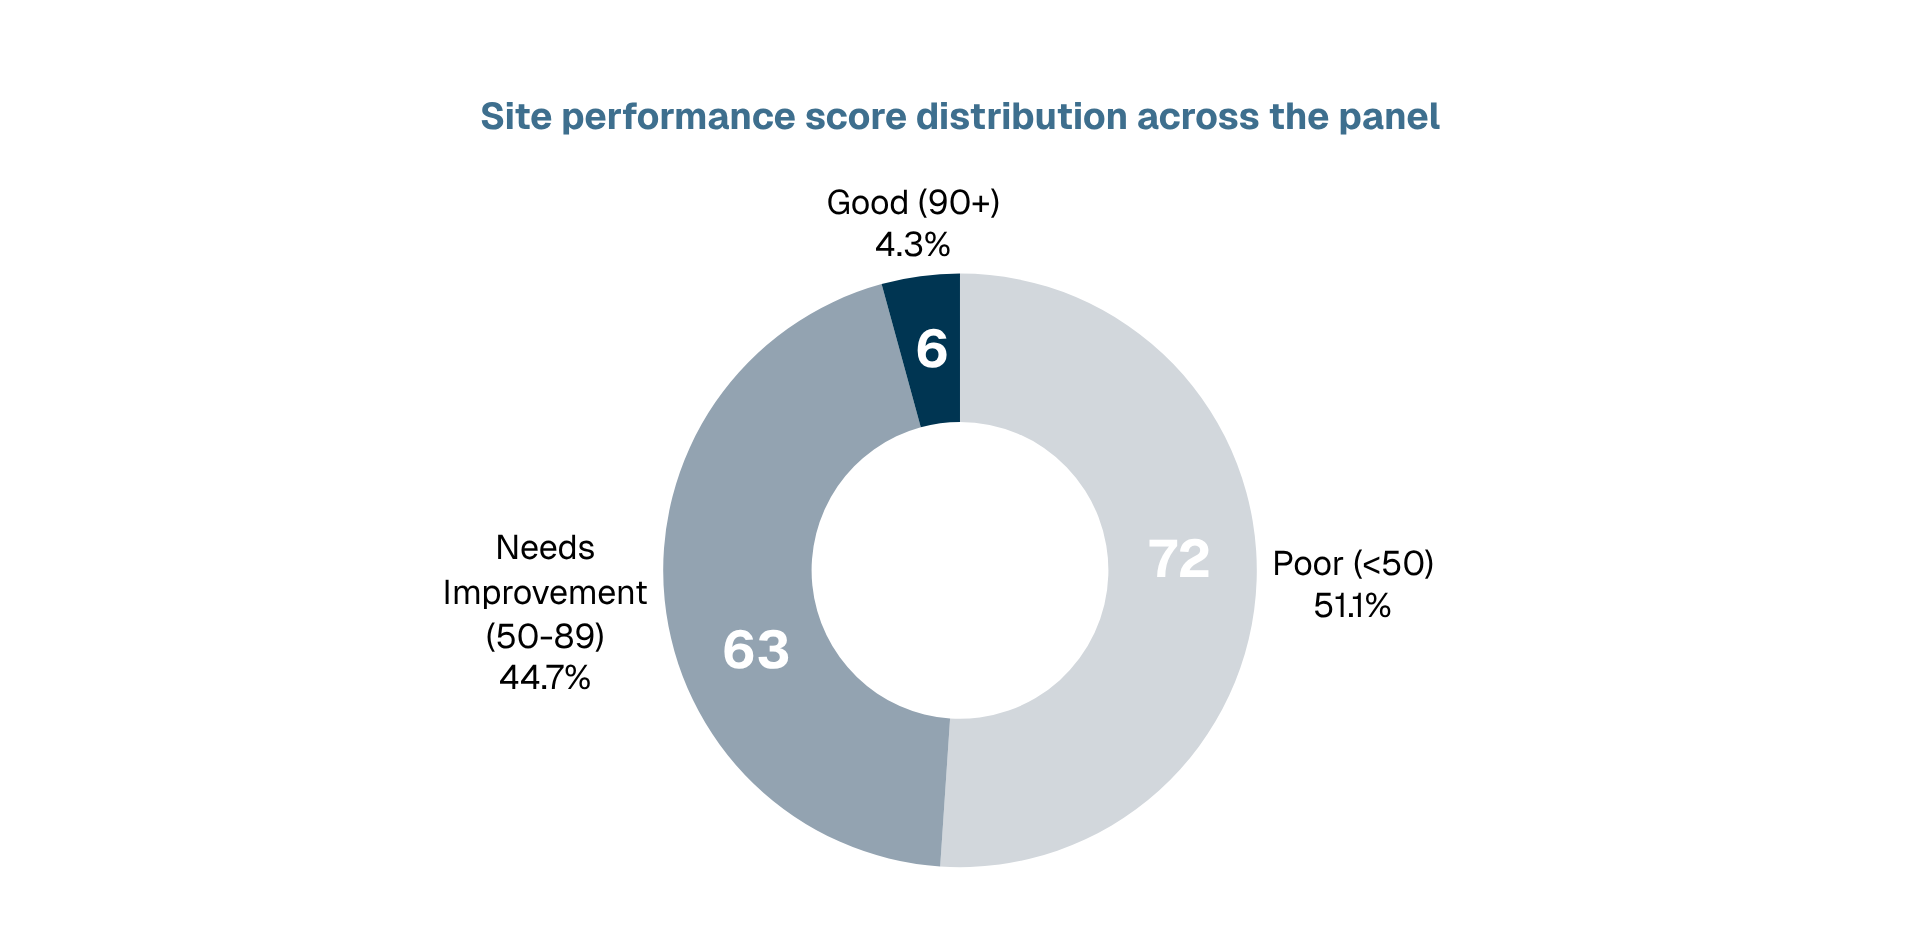
Based on Google PageSpeed Insights data, only 4.3% of the panel score in the “Good” range (90 and above). In contrast, more than half the panel (51.1%) registered a Performance Score of “Poor”, while the remaining 44.7% sit in the “Needs Improvement” band (50–89).
These poor performance scores indicate that most of the sector may be losing leads due to a slow load time and a poor user experience.
Websites with low traffic, demonstrated in an earlier finding, cannot afford to have slow loading times. Every lead is valuable, and a lost lead due to poor UX is costly in terms of pipeline.
With performance this predominantly weak, site speed is an underutilized opportunity for businesses in this sector to differentiate on. A company that invests in it stands out against a panel where “Good” is rare enough to be a genuine differentiator.
Head over to Google PageSpeed Insights and see how your company stands vs the sector.
2. Speed Isn’t What’s Separating Today’s Visibility Leaders
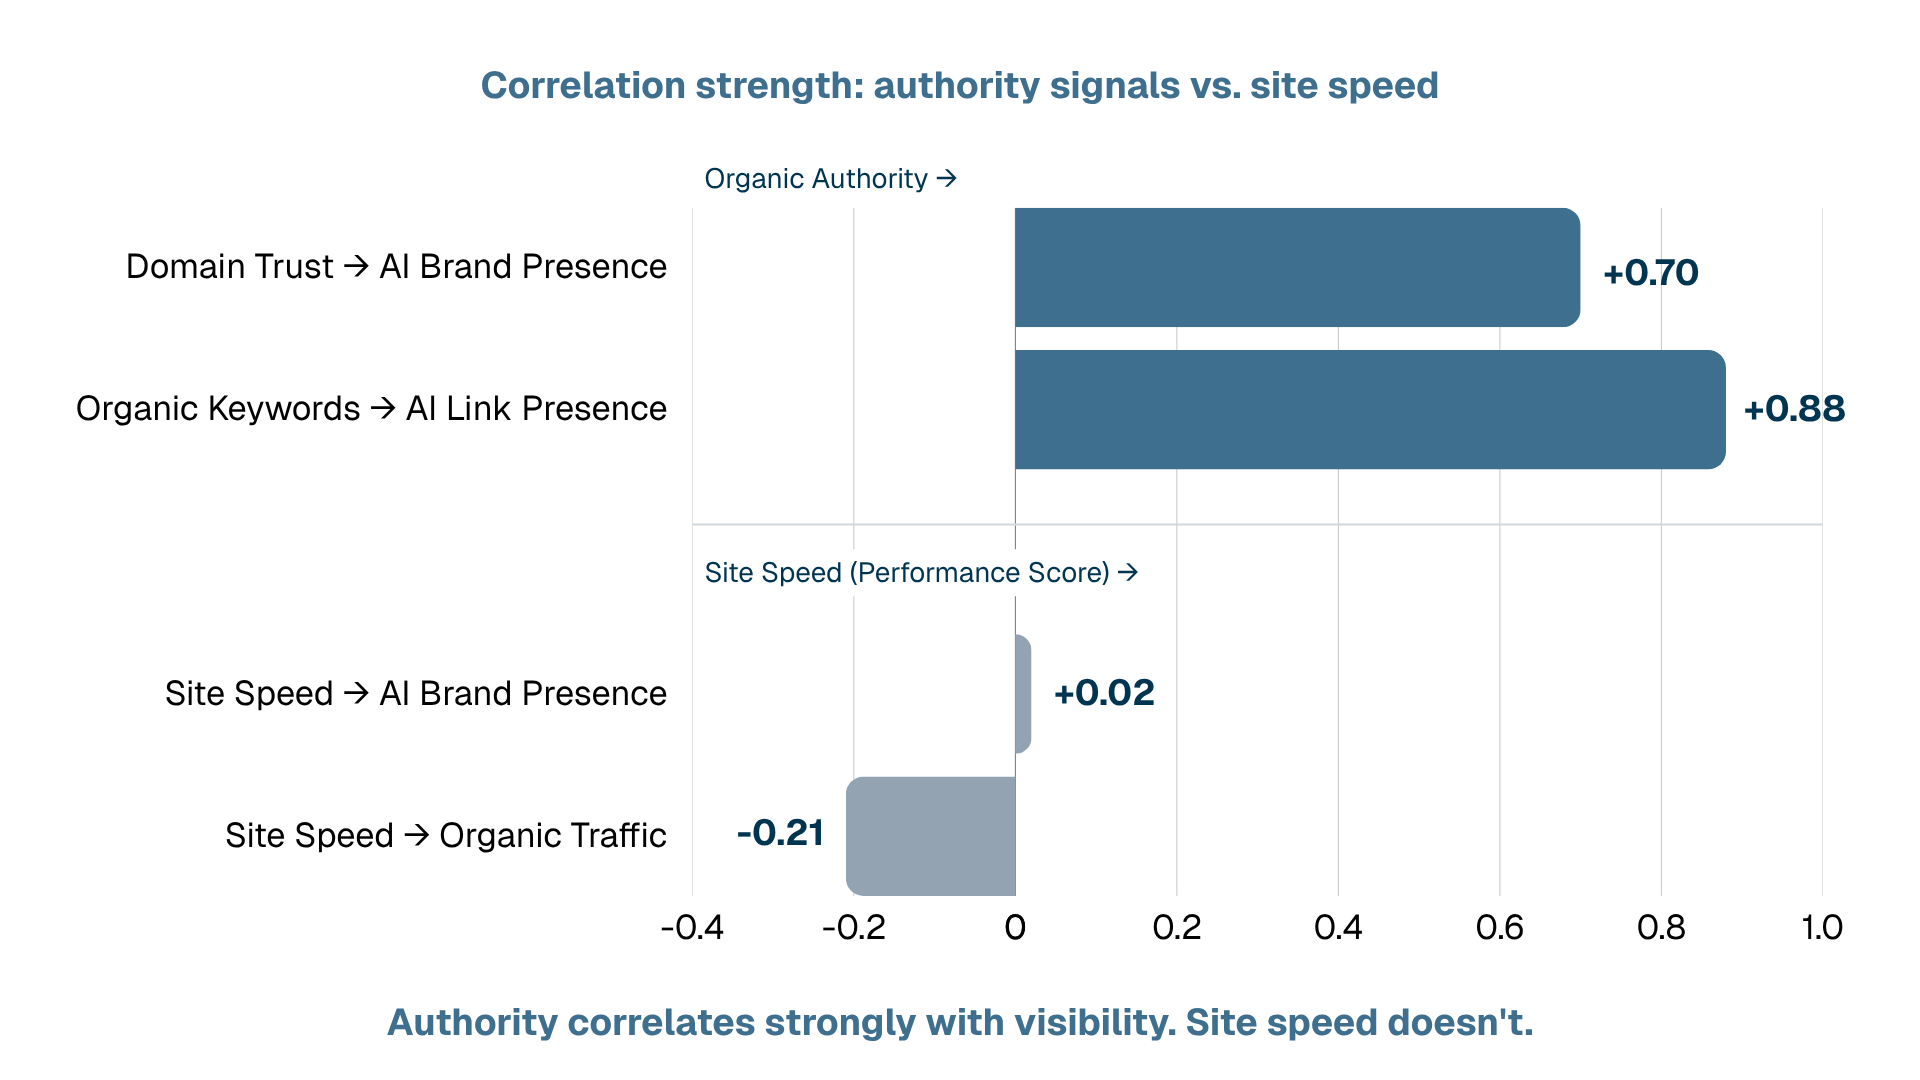
While site speed leads to poor UX, our data shows that site speed has little to no correlation with organic or AI visibility— Spearman correlations ranging from −0.21 to +0.02 across every visibility metric measured, none of them statistically meaningful.
This means that a faster site does not contribute to higher visibility on traditional search or on AI engines. Site speed may affect your conversion rates, but not your visibility. A comparison of the correlation of various metrics in this study is shown below.
Research Findings | Martech and Marketing Automation
1. HubSpot Marketing Automation Is Already the Sector Default, Especially at Mid-Size Companies
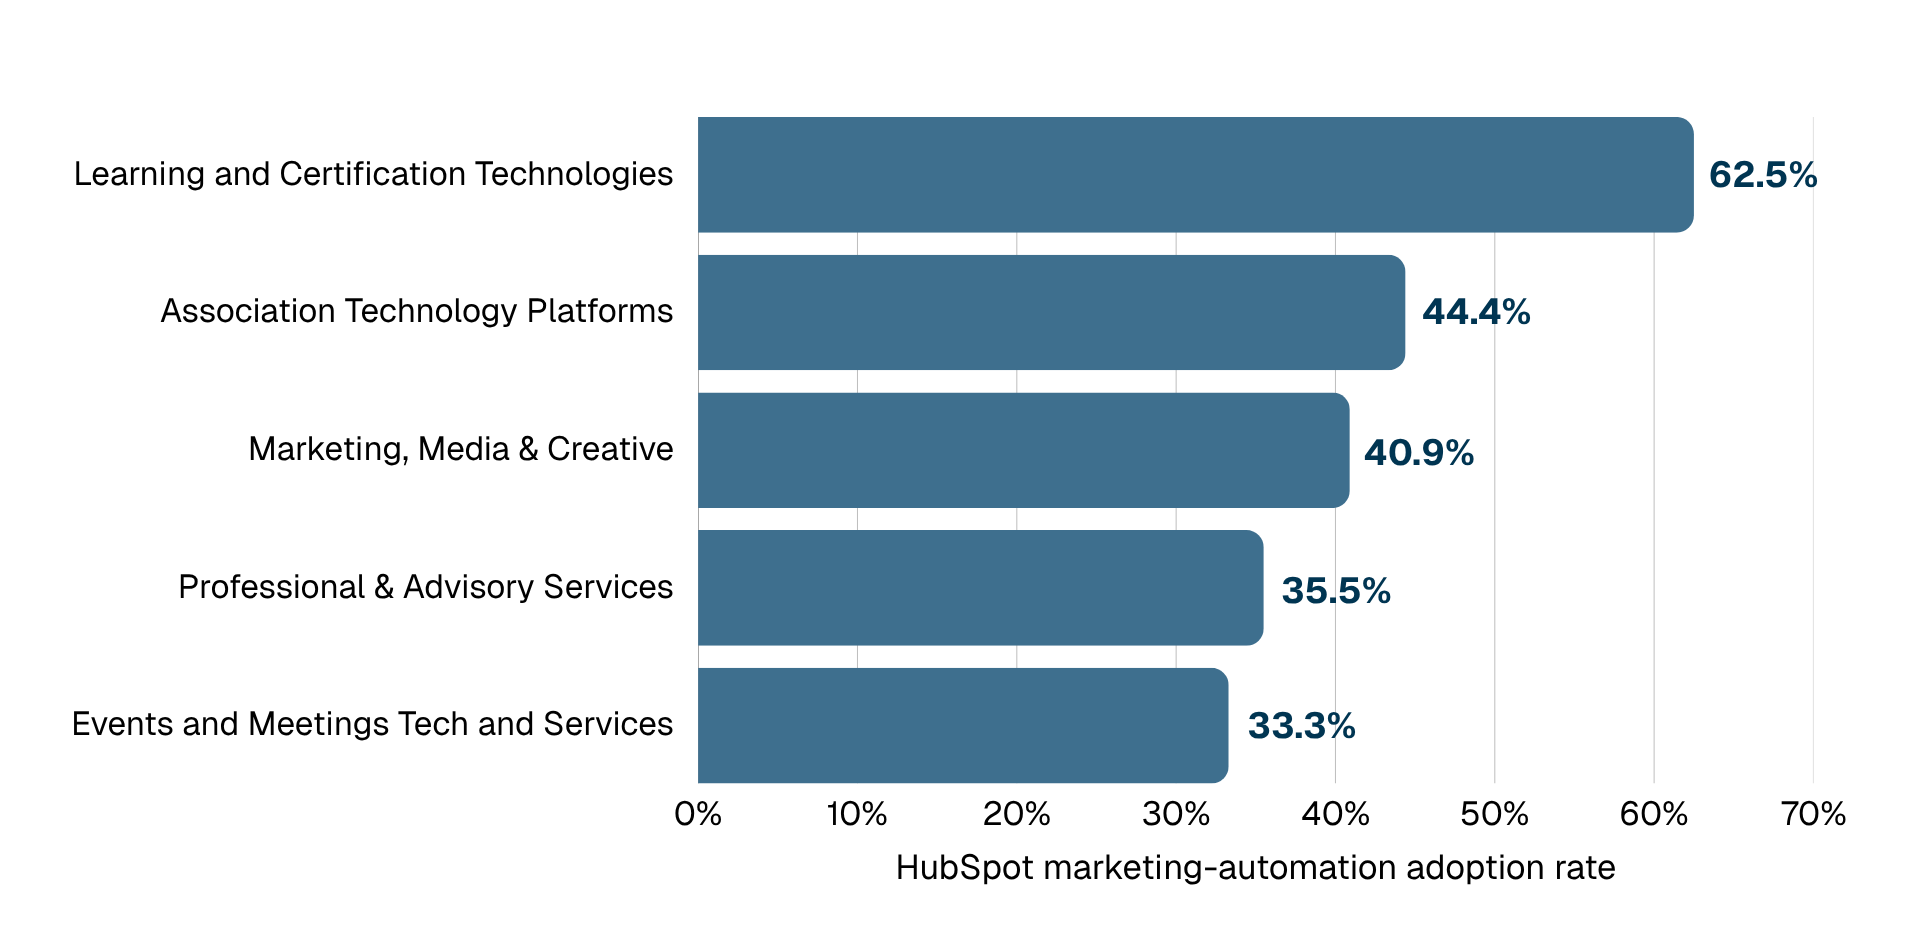
40.9% of successfully-scanned sites in the panel run HubSpot marketing automation. For companies with 51–200 employees, HubSpot adoption shoots up to 64.9%.
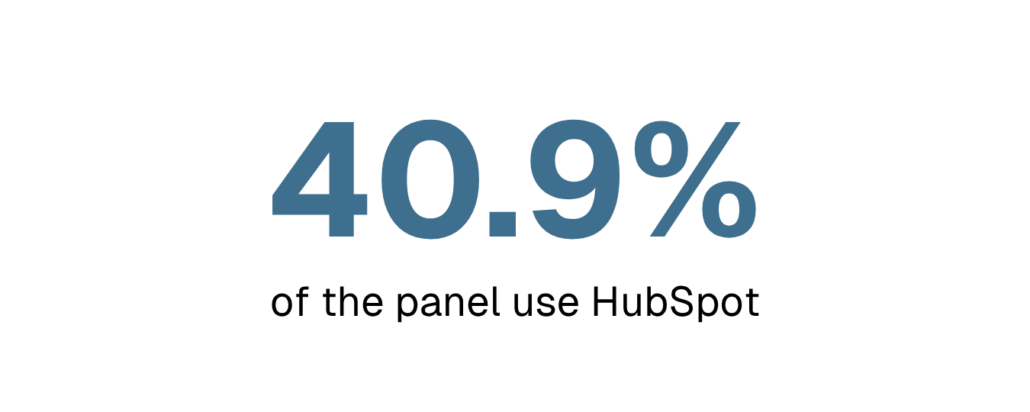
Adoption also varies per category, ranging from 33.3% – 62.5%
2. Pattern spotted: Websites that run HubSpot demonstrated better visibility metrics
Companies that run HubSpot marketing automation outperform those that don’t on every visibility metric measured: organic traffic (a median of 475.5 versus 286.5), organic keywords (1,495 versus 958), AI Brand Presence (29.0 versus 16.0), AI Presence Combined (124.0 versus 68.5), and estimated AI-referral traffic (22.0 versus 12.5). The one exception is AI Average Position, where the HubSpot and non-HubSpot groups were essentially tied.
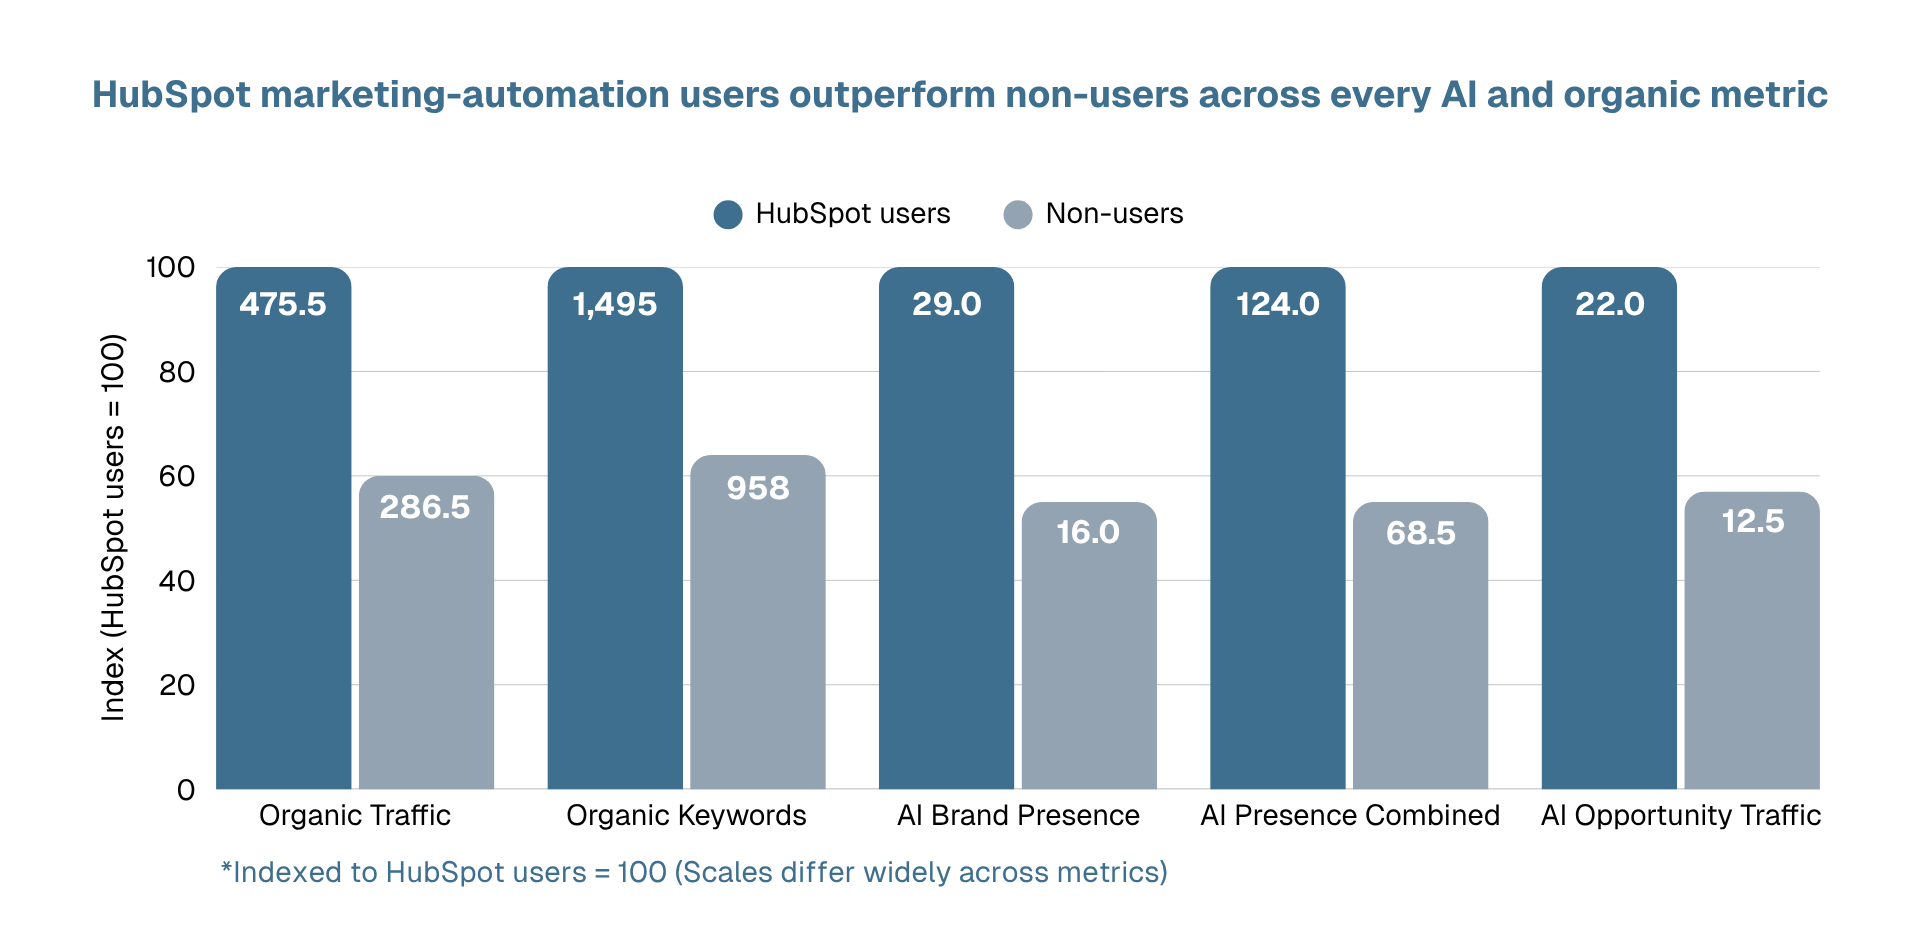
We can’t say adopting HubSpot causes this difference — correlation isn’t causation, and companies that invest in marketing automation likely also invest more broadly across the board. But the pattern is evident, and it’s worth investigating for any organization in this space.
3. WordPress Still Predominates as the Category’s CMS.
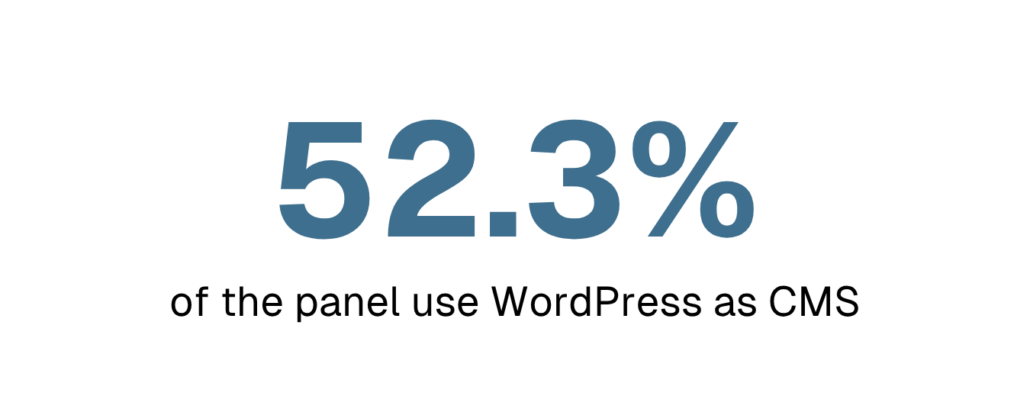
52.3% of successfully-scanned sites run WordPress. Other CMS types detected include Webflow (11.4%), HubSpot’s own CMS (4.5%), Drupal (3.0%), Squarespace (1.5%), Joomla (0.8%).
4. Paid-Social Tracking Is Small but Present
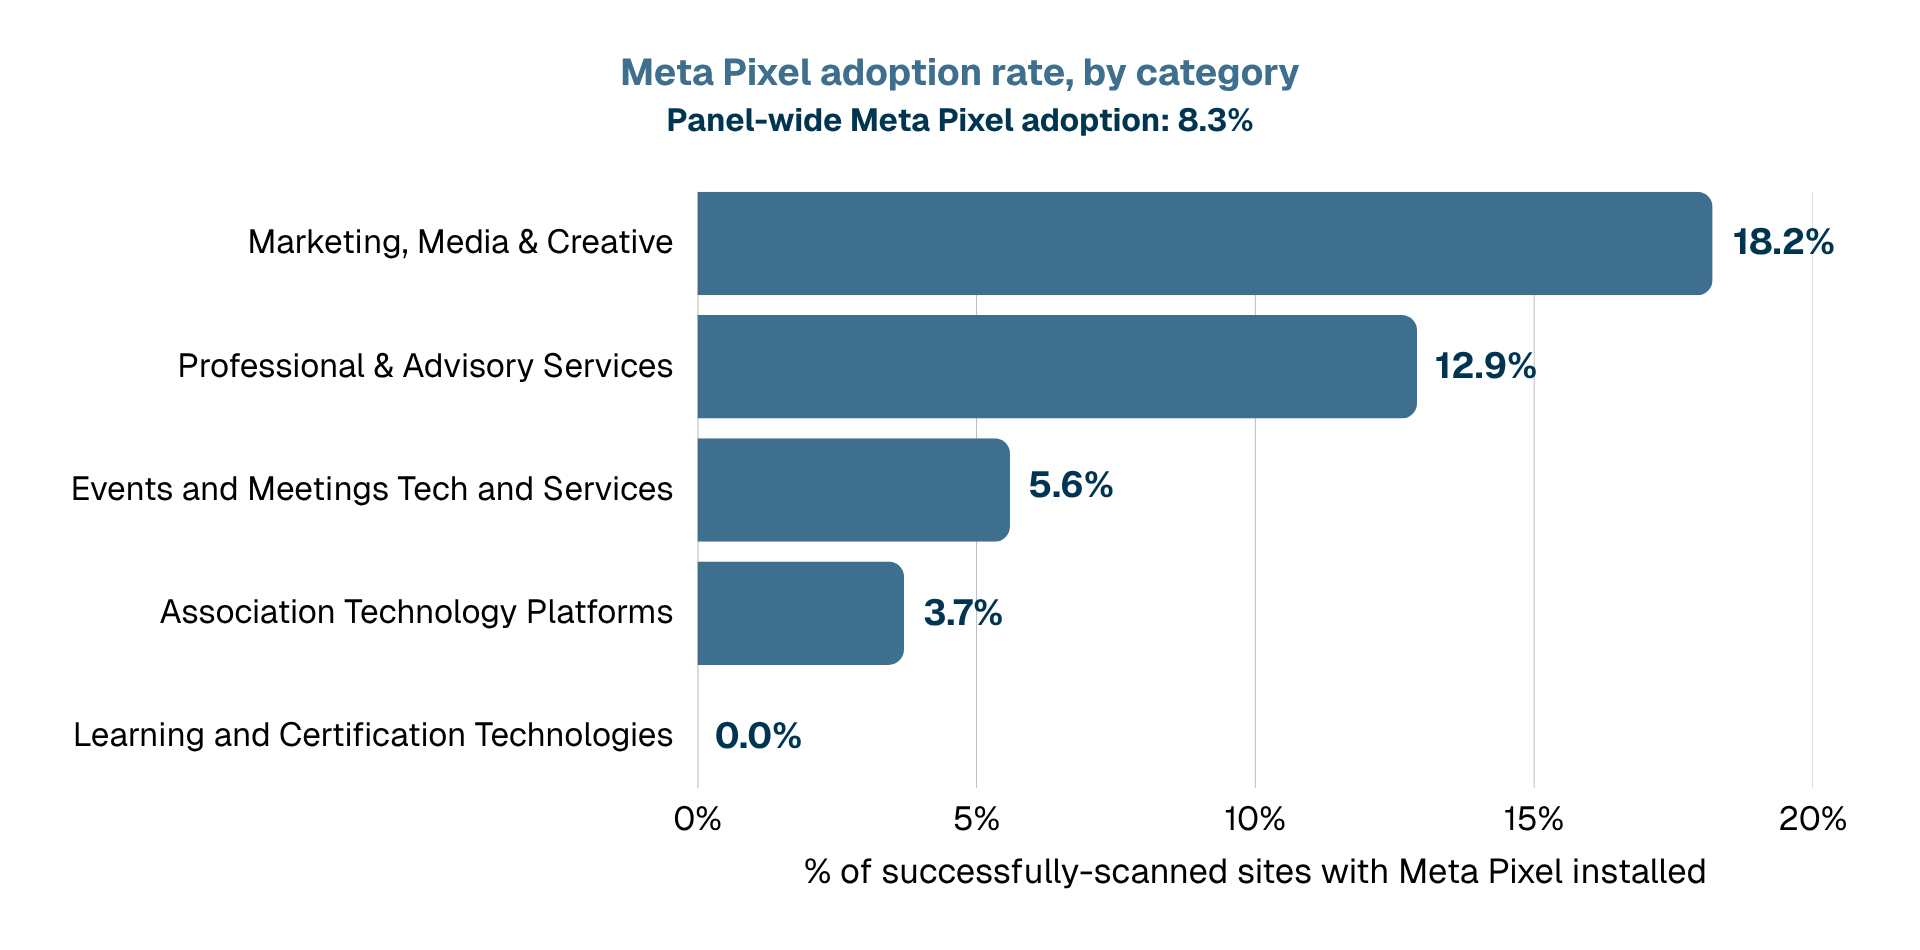
8.3% of successfully-scanned sites show a Meta Pixel installed compared to 0 sites using Meta Pixel from our nonprofit benchmark report. Presence of the Meta Pixel skews toward Marketing, Media & Creative (18.2%) and Professional & Advisory Services (12.9%). Meta Pixel detection was much lower in Events and Meetings Tech (5.6%), Association Technology Platforms (3.7%), and Learning and Certification Technologies (0%).
Paid-social infrastructure is still a minority behavior in this sector, but this finding shows it’s not nonexistent. The spread across categories is also worth noting, given its wide range.
Key Takeaways for CMOs
Winning Organic Search and Winning AI Search Are Largely the Same Fight
An earlier finding showed us that Domain Trust is highly correlated with AI Brand Presence, while Organic Keywords correlates even more strongly with AI Link Presence. These stats alone show how traditional SEO KPIs like site authority and ranking for more keywords contribute to a brand’s visibility on AI engines.
When we split the panel into quadrants based on high/low organic traffic and high/low AI presence, the pattern only strengthens: majority of the panel are either strong in both organic traffic and AI presence, or weak in both.
46% of companies land in “Dual Leader” — sitting above the median on both organic traffic and combined AI presence. On the other extreme, 44% are underperforming “Laggards”, with below median values for organic traffic and combined AI presence. Only 10% split the difference, doing well on one channel while lagging on the other.
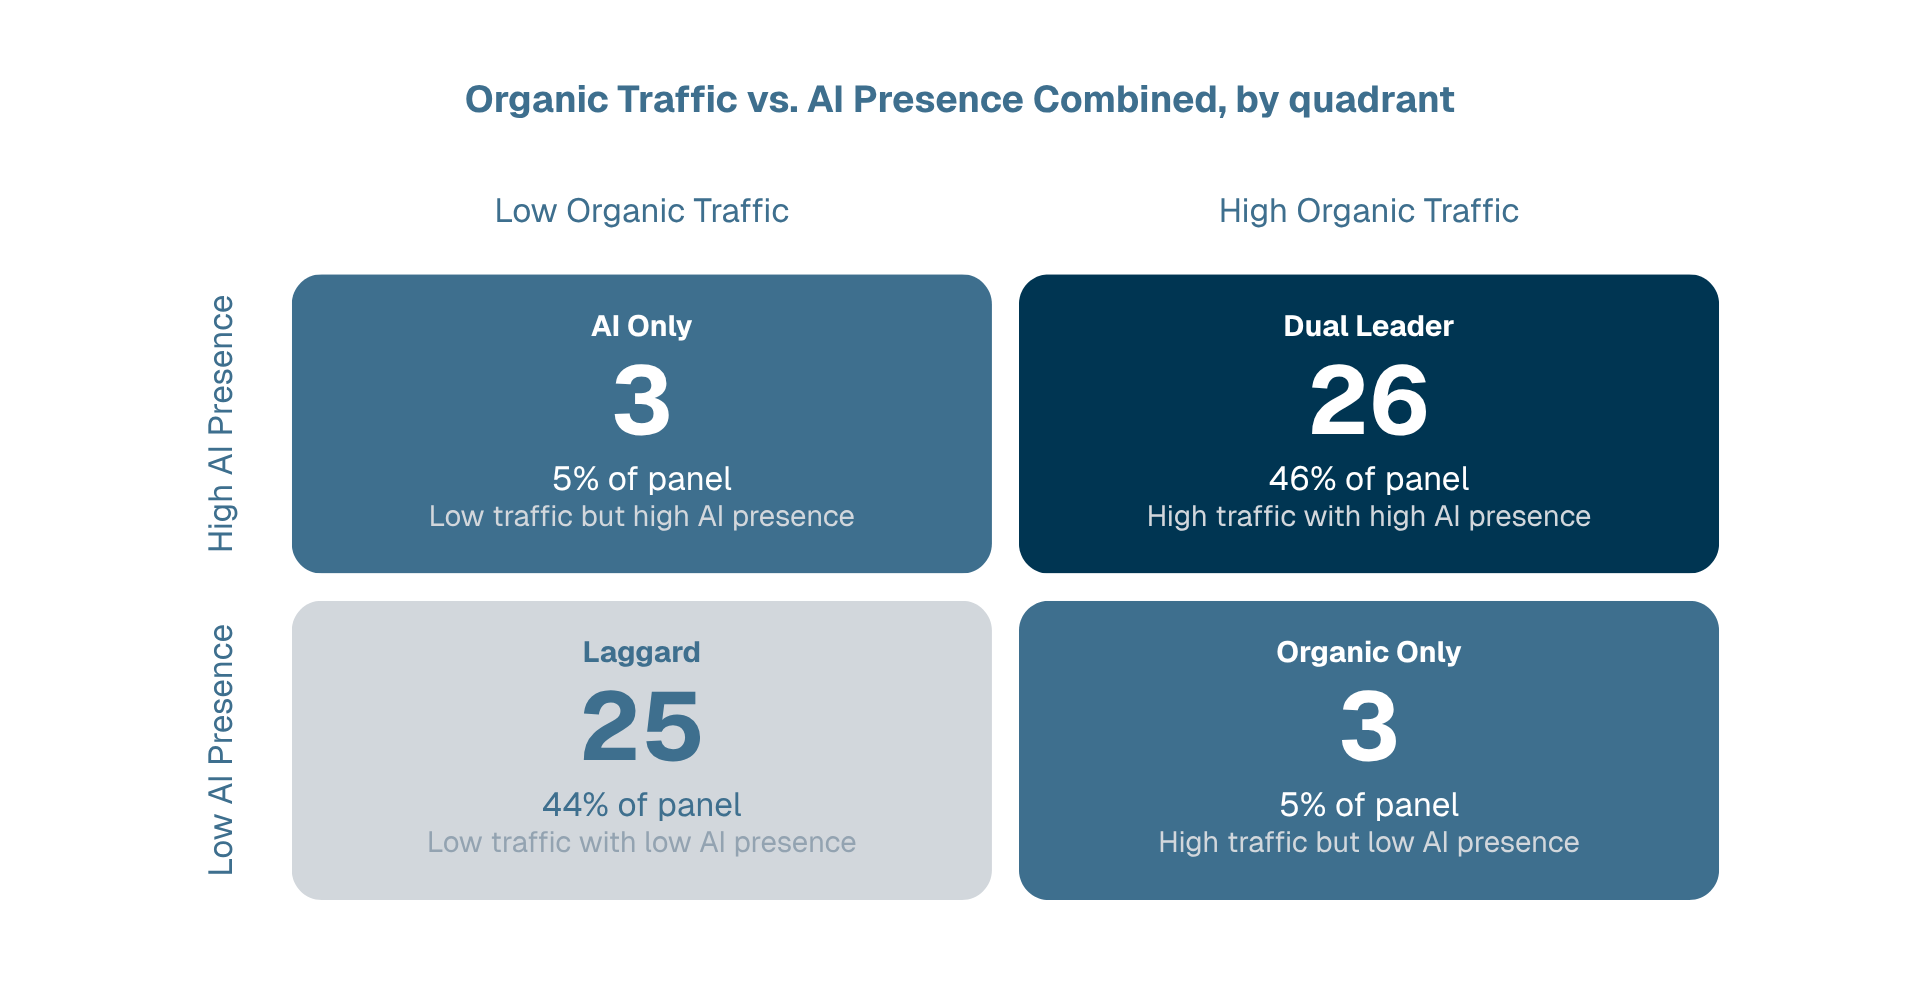
In other words, 9 out of 10 companies in this panel are either winning both channels or losing both. Very few manage to be strong in one and weak in the other. Organic authority is close to a precondition for AI visibility, and not just for a handful of category leaders. It’s the dominant pattern across nearly the entire panel.
For a CMO, “organic strategy” and “AI visibility strategy” aren’t really two separate investments to weigh against each other. They’re much closer to the same investment showing up in two places.
This finding also surfaced in a parallel benchmark report, SEO and AI Visibility Benchmarks of Nonprofit Vendors.
Proof That Smaller Companies Can Win: One Company Out-Competes Rivals Many Times Its Size
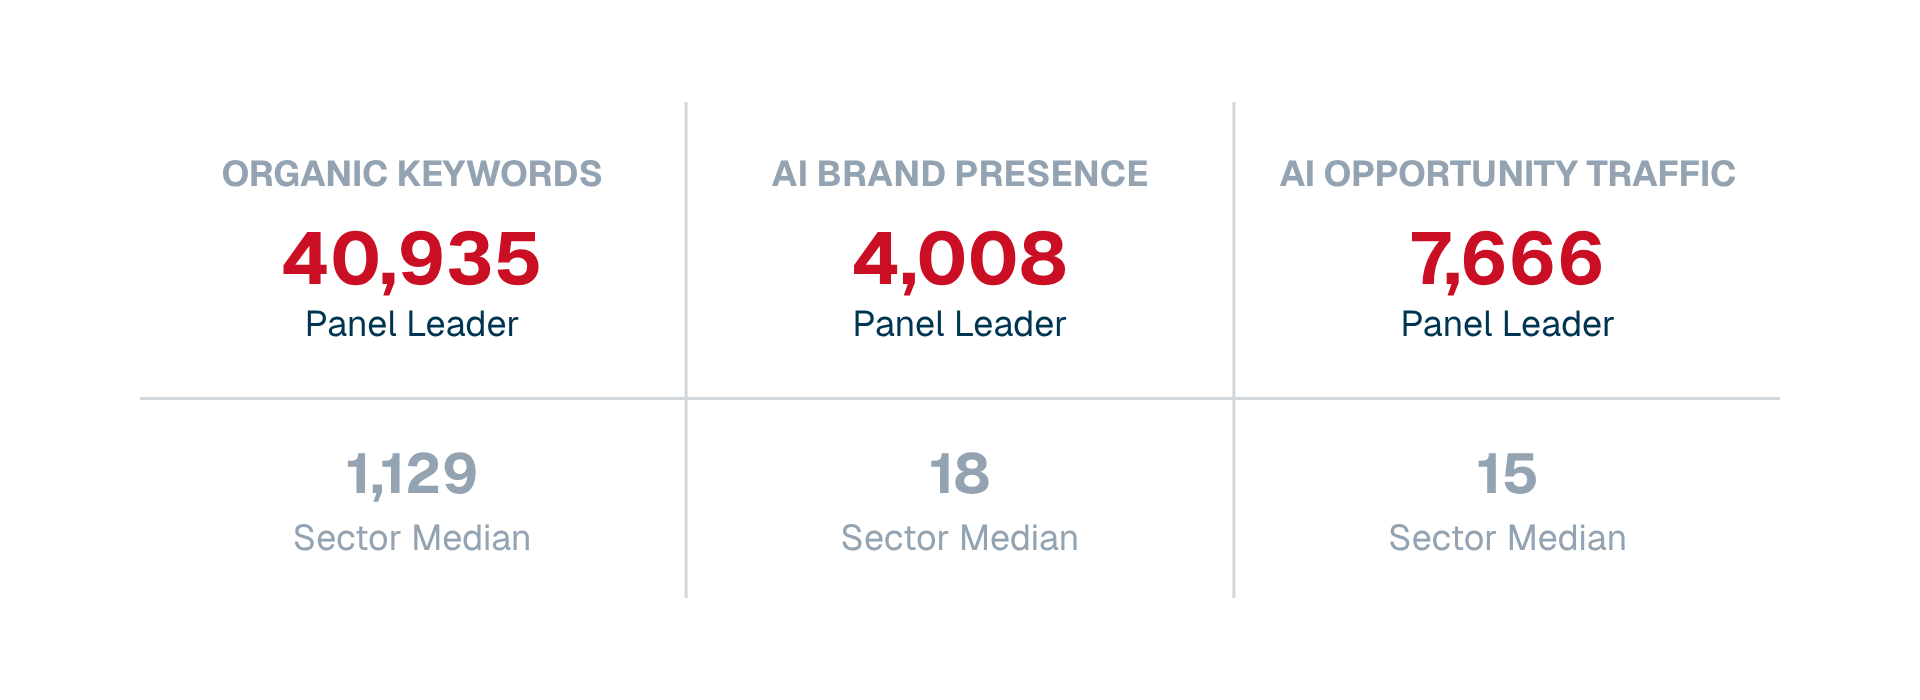
One company in the panel with only 11-50 employees (the smallest band) and $1M-$5M in revenue (smallest revenue band) held the single highest AI Brand Presence value of all 57 companies measured.
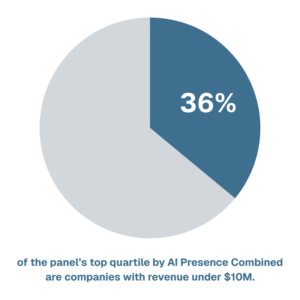
It isn’t an isolated fluke, either: more than a third (36%) of the panel’s top quartile by AI Presence Combined are companies with revenue under $10M. This shows that smaller, sharper organizations can out-execute larger ones.
You May Not Be Able to Out-Scale the Leader. You Can Out-Precision Them.
As an earlier finding pointed out, AI presence (volume of mentions) only weakly correlates with AI Average Position (how high you rank on an AI engine’s recommendation). CMOs can thus play the precision game – you can aim to rank higher for prompts that your buyers typically use, rather than show up for a wide range of prompts.
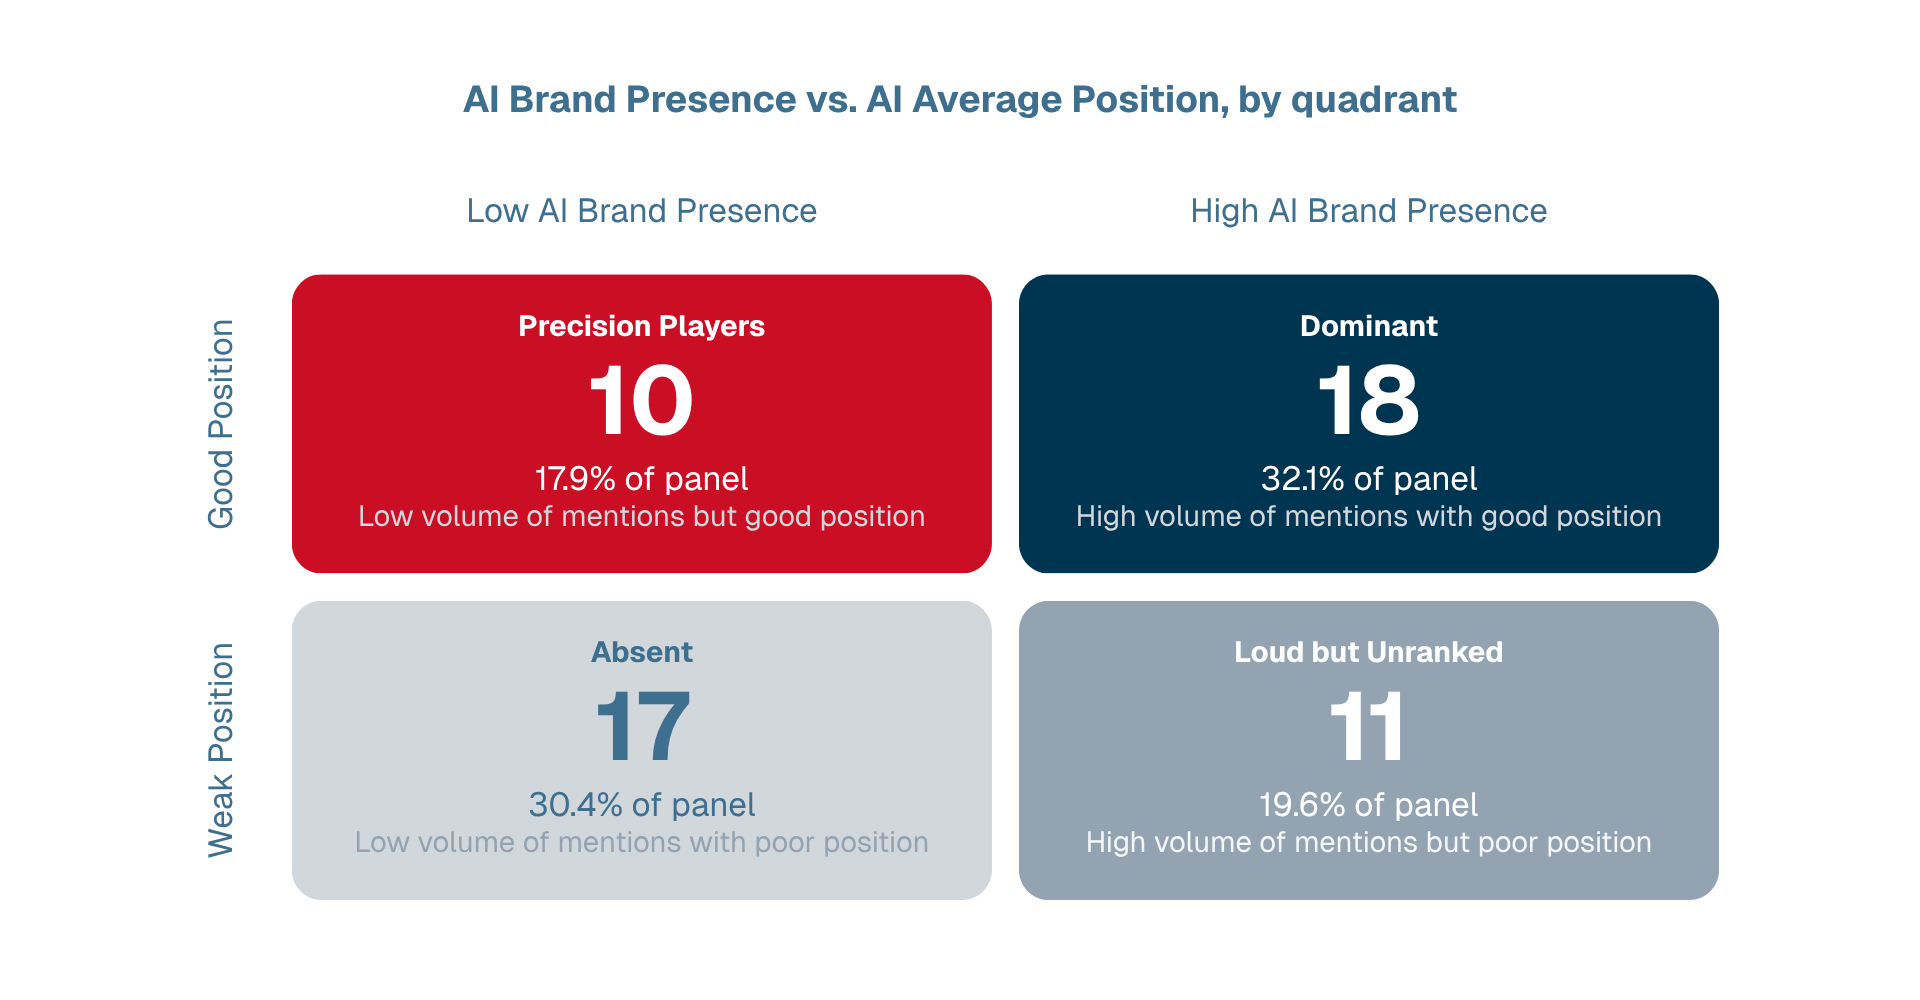
Zooming into the “Precision Players” quadrant identified earlier, these are companies posting low mention volume but a better-than-median AI average position. Out of the 10 precision players, 3 of these companies outrank the sector’s established category leaders, despite posting only a fraction of their mention volume.
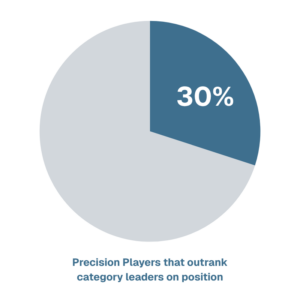
This shows that a company that can’t out-produce the category leaders on quantity and volume can still win, by optimizing on the quality and precision of the citations it gets. For a smaller vendor, that’s a far more achievable strategy than trying to out-spend or out-publish the category leaders.
Category Benchmarks for B2B Vendors Selling to Nonprofits
A quick-reference table for readers who want to see how their own metrics compares to their peers.
| Category | Median Organic Traffic per month | Median Domain Trust | Median Combined AI Presence (Brand Presence + Link Presence) | Mean Performance Score (PageSpeed Insights) | HubSpot Adoption |
|---|---|---|---|---|---|
| Association Technology Platforms | 288 | 75 | 129 | 54.4 | 44.4% |
| Events and Meetings Tech and Services | 375 | 76 | 32 | 48.7 | 33.3% |
| Learning and Certification Technologies | 243 | 74 | 132 | 54.6 | 62.5% |
| Marketing, Media & Creative | 312 | 72 | 95 | 48.0 | 40.9% |
| Professional & Advisory Services | 405 | 68 | 86 | 59.1 | 35.5% |
Note: Companies identified to serve a very broad range of industries and whose services are not specific towards associations were excluded from this report. However, a small number of the panel’s leading companies still serve markets well beyond the association sector — one, for instance, operates broadly across higher education, nonprofit, and corporate learning-and-development, while also marketing to associations’ use case specifically. These companies were retained because many association-sector vendors serve overlapping markets too. It would be unrealistic to exclude these companies, since these are real players in the association vendor space. They occupy real market share and are a viable competitor. But wherever an outsized gap-to-median figure appears in this report, some of that gap reflects a larger addressable market, not purely superior execution against association-focused peers. Worth keeping in mind as a general caveat on this report’s largest numbers.
About the Authors

Kendall Lake
Kendall leads agency operations for Nexus Marketing, where she directs the account management, content, strategic partnerships, and new services divisions. She is passionate about helping clients in the mission-driven space reach their customers through impactful SEO, content, and digital marketing strategies.
A proud Double Dawg, Kendall earned her bachelor’s in journalism and her master’s in emerging media from the University of Georgia. Before joining Nexus, Kendall worked in presentation development and curation for TEDxUGA, one of the largest independently organized TEDx events.

Kristine Yu
Kristine oversees all marketing activities for Nexus Marketing itself, applying the same strategic discipline Nexus brings to client work toward building the agency’s own marketing engine.
She is experienced in marketing and communications in B2B SaaS and tech consulting, though she kickstarted her marketing and product management career in the food & beverage industry. With a background in the sciences, she carries an analytical, data-first lens into marketing strategies and decisions.

Maggie Chagoya
As leader of the Account Management team at Nexus Marketing, Maggie is dedicated to devising strategic marketing strategies for clients in the mission-driven sector. She specializes in building long-term organic authority and visibility that connects Nexus’s clients with their most important audiences. Under her leadership, the account management team seeks to develop relationships with clients and implement marketing solutions that drive ROI.
Maggie currently volunteers with LifeLine Animal Project in Atlanta. Advocacy for those with Intellectual and Developmental Disabilities is another cause close to her heart.