Nexus Updates: Multimedia Content Campaigns & Design Services
Curious how multimedia content campaigns and design services from Nexus Marketing can support your brand?
Our services are designed to help you sustain that impact, strengthen your brand, and win more business without draining your team’s time and resources.
Whether you need lead capture resource creation, sales enablement, brand-building, or general design support, we have the mission-driven expertise and design chops to help.
This guide provides a quick overview of our design services and what you can expect when you partner with the Nexus team.
Quick context
Our content, design, and branding services are offered in addition to any existing SEO, GEO, and/or HubSpot work with Nexus Marketing.
If you’ve already worked with Nexus for “Full-Funnel” design work (our previous iteration of this service), you’re likely familiar with the range of content and design collateral we can create.
Our updated packages now provide greater structure and repeatability, helping you build a truly valuable and cohesive content library rather than one-off solutions. Nexus Marketing also brings true sector expertise — we’re the leading agency serving mission-driven brands. We understand your audience and what they’re looking for when making buying decisions.
Layer our years of experience onto a scalable multimedia campaign structure, and you can build a true lead generation engine that speaks to your audience and drives results for your brand.
If you have any questions or want customized recommendations, please reach out to your Nexus account team or explore our design service overview page.
Our design services
We offer three ways to tap into our updated design services:
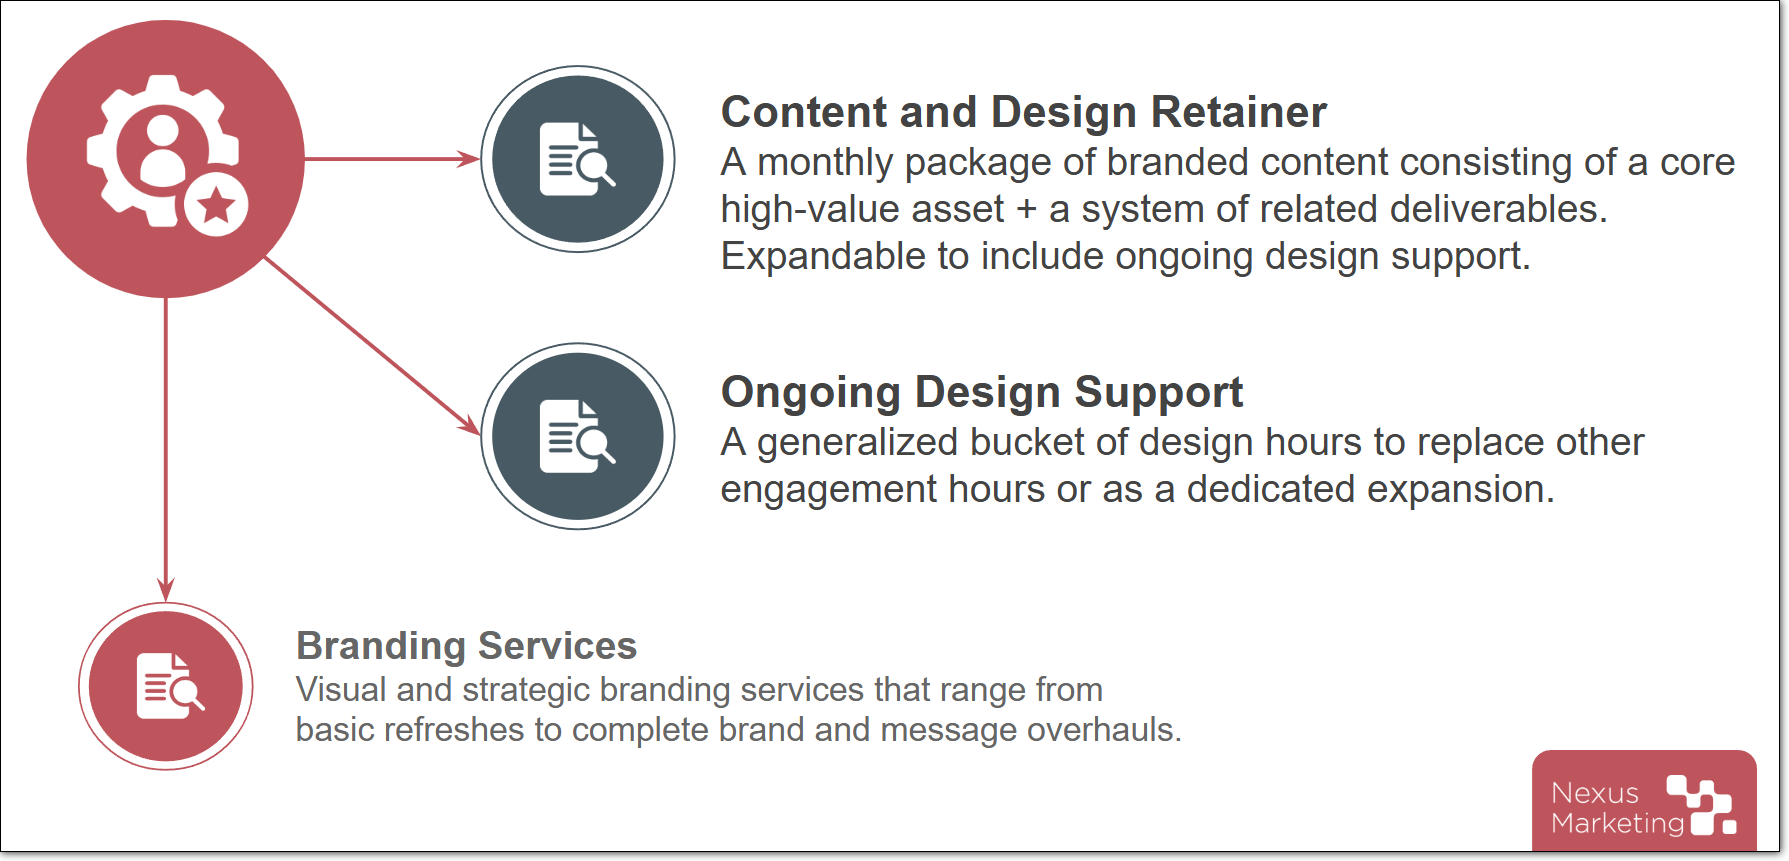
1. Content and design retainers
While one-off design efforts address your immediate needs, our strategic design packages are curated to build sustained momentum and drive long-term value.
How these packages work:
- Your design retainer serves as a monthly content engine, ensuring a steady stream of assets to support your brand.
- An Anchor Asset (a high-value lead capture resource or webinar) is selected, developed, and distilled into a variety of multichannel assets.
- Your Anchor Asset can be designed to meet a custom need or follow one of our recommended approaches:
- Subject matter interviews converted into clickworthy guides and opinion pieces
- Proprietary data turned into branded state-of reports and industry trend guides
- Voice of customer insights from your own sales calls formatted into sales enablement materials
- Webinar recaps, polished eBook versions of your events to use for lead capture or follow-up
- Webinar production packaged with additional shortform clips and multichannel assets
- Your Anchor Asset can be designed to meet a custom need or follow one of our recommended approaches:
- A tiered service structure and optional add-ons help you build the package that best meets your needs.
These packages can also be expanded with additional design support hours to meet your changing needs.
Learn more about content and design retainers here.
2. Ongoing design support
These services function like our existing approach, providing targeted design support for campaigns and assets such as webinar kits, sales enablement collateral, and video production. These hours can be swapped into an existing Nexus engagement or added as a dedicated expansion.
With this service, Nexus operates as a dedicated, on-demand creative resource, saving you time and upping the visual quality of your visual materials.
3. Brand identity and strategy
Brand identity is the foundation of the impression your business makes on potential customers.
Whether you’re looking to refine an existing look or build a new identity from the ground up, the Nexus team can provide strategy development and visual design tailored to your unique goals. Our branding services range from foundational brand refreshes—focusing on core elements like logos and color palettes—to comprehensive identity systems that define your brand’s voice, positioning, and visual language.
Learn more about our branding services here.
Example design deliverables
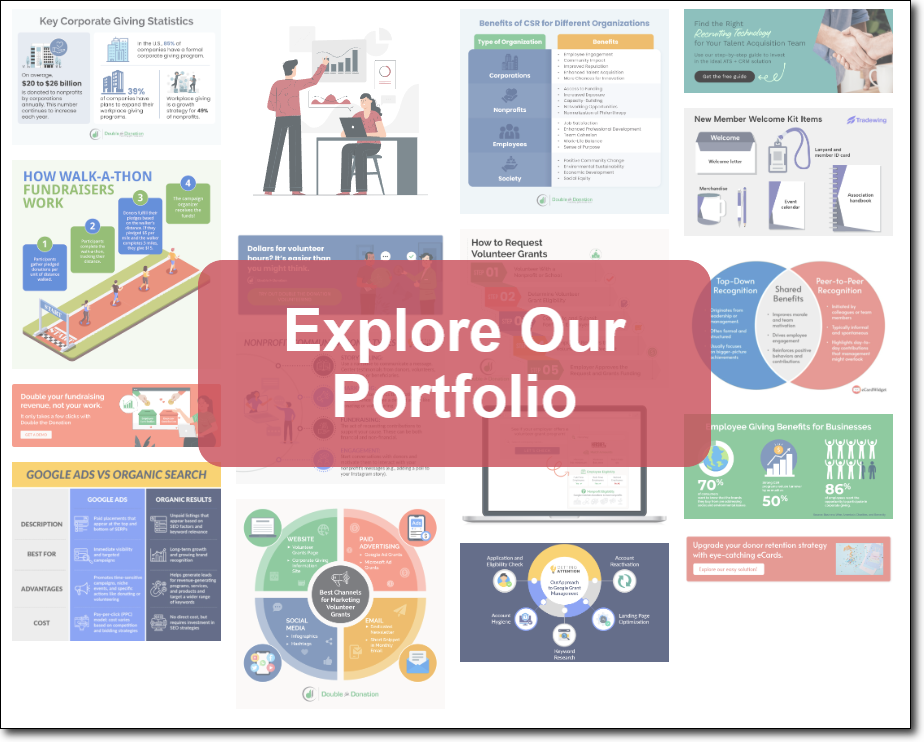
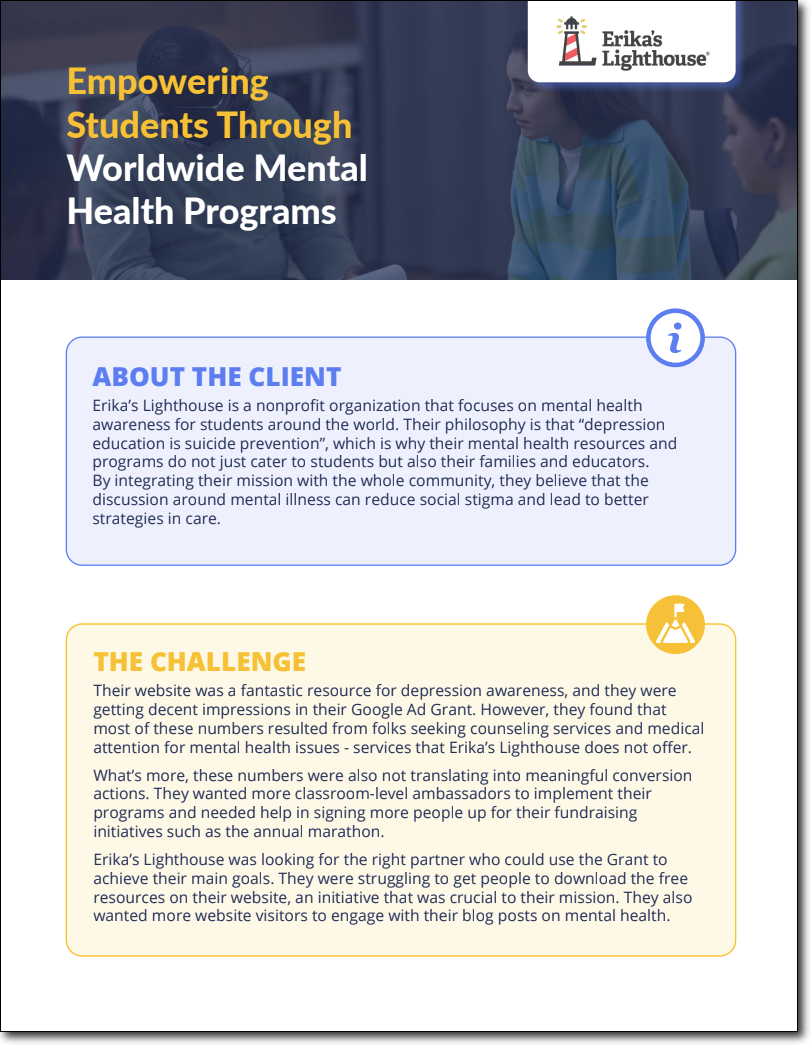
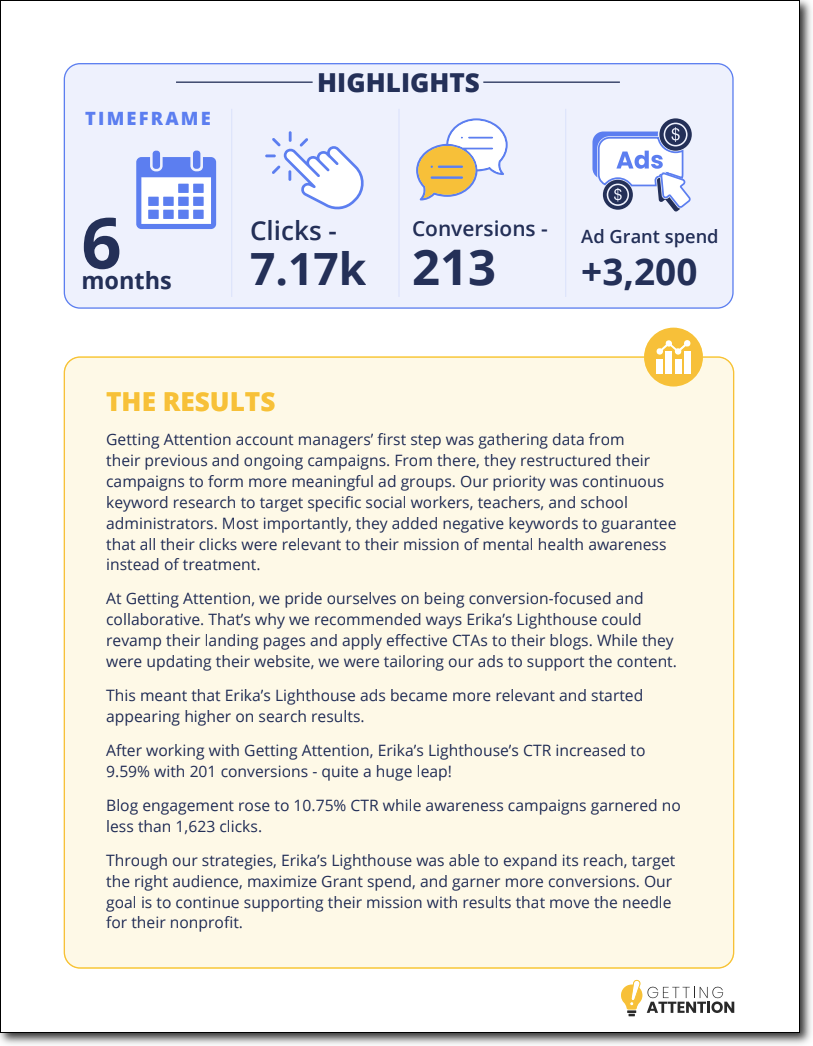
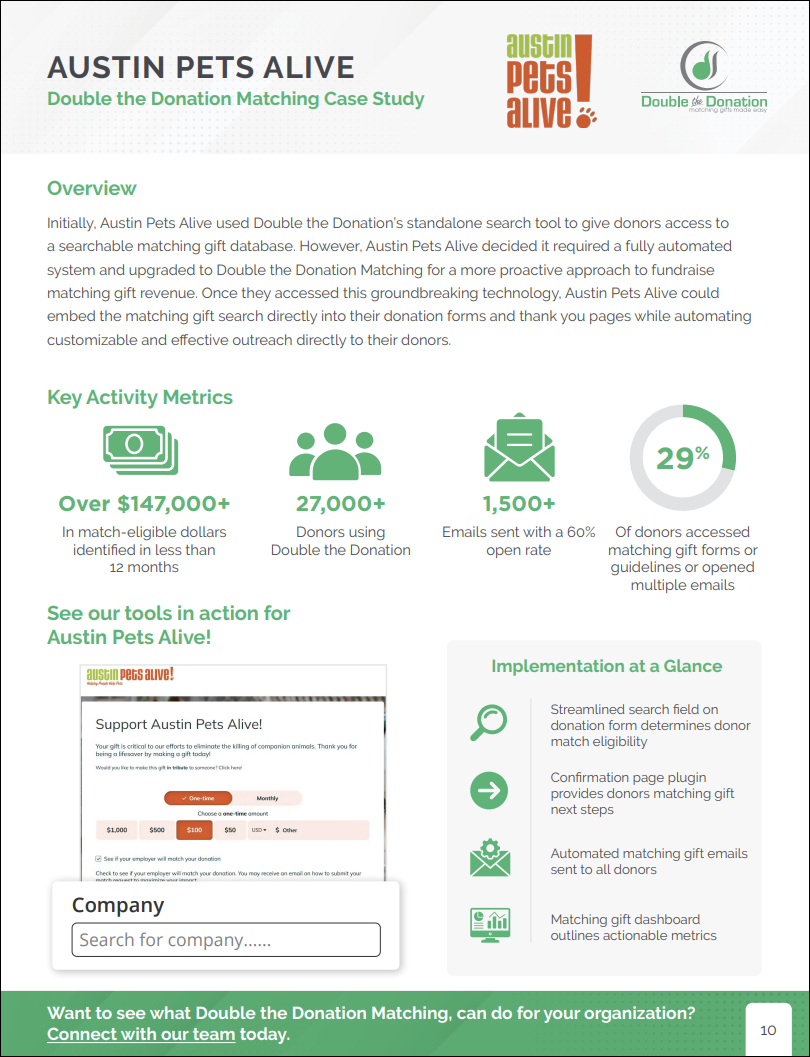
Check out this collection of sample design deliverables we’ve produced:
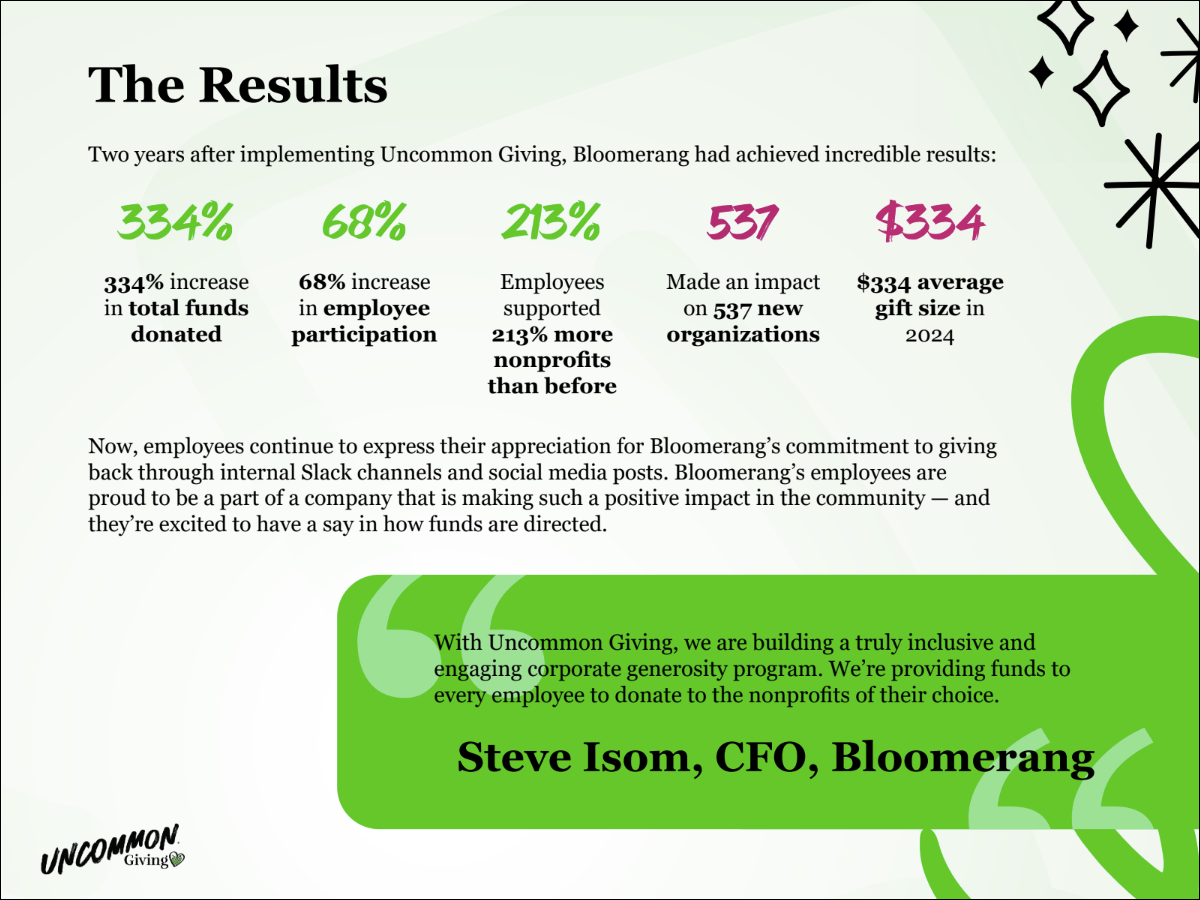
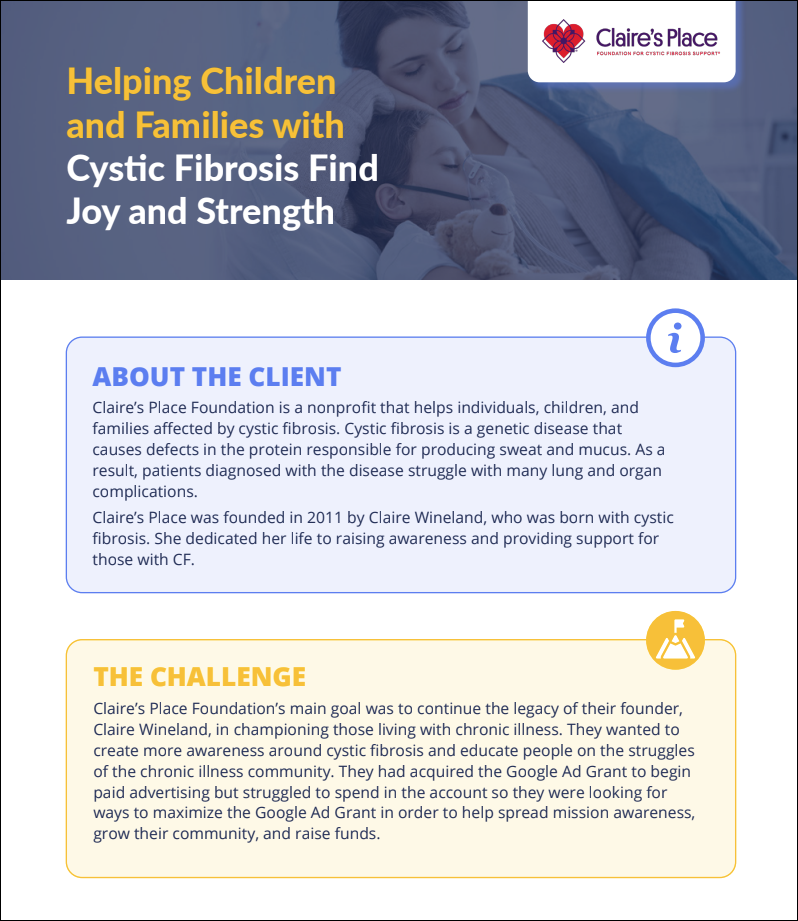
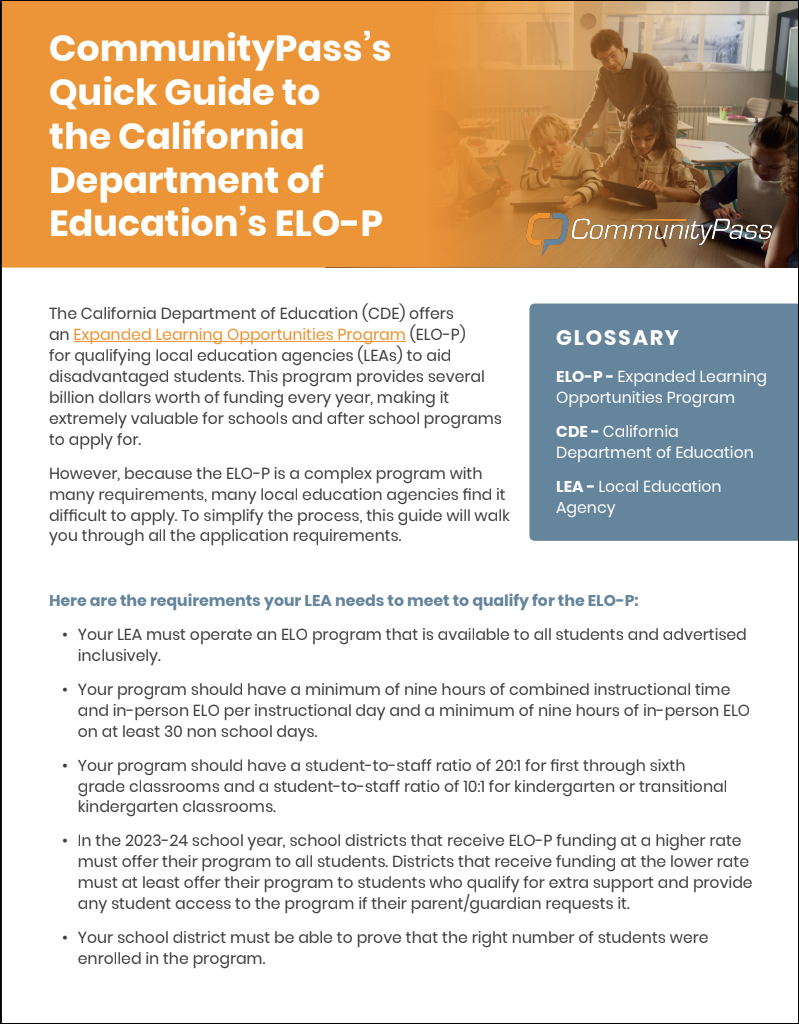
Technical resource for a localized education audience
Boosts credibility, provides value, and reinforces brand

Branded sales deck
Makes a stellar impression, easily templatized for future use

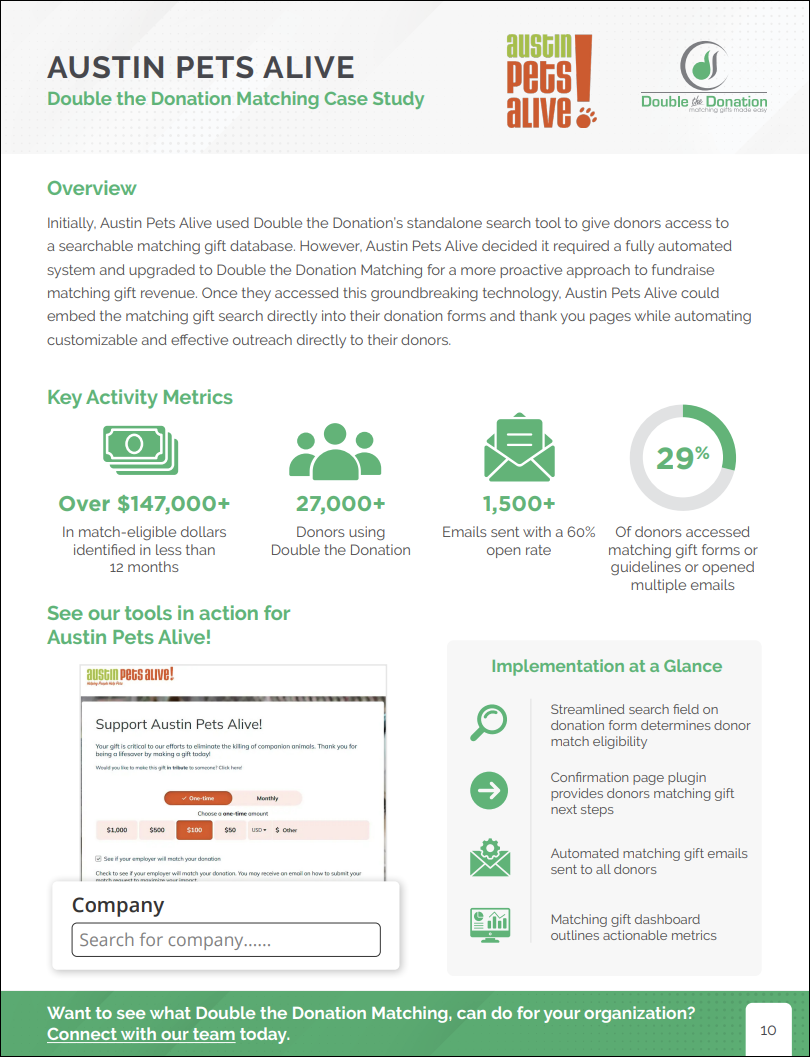
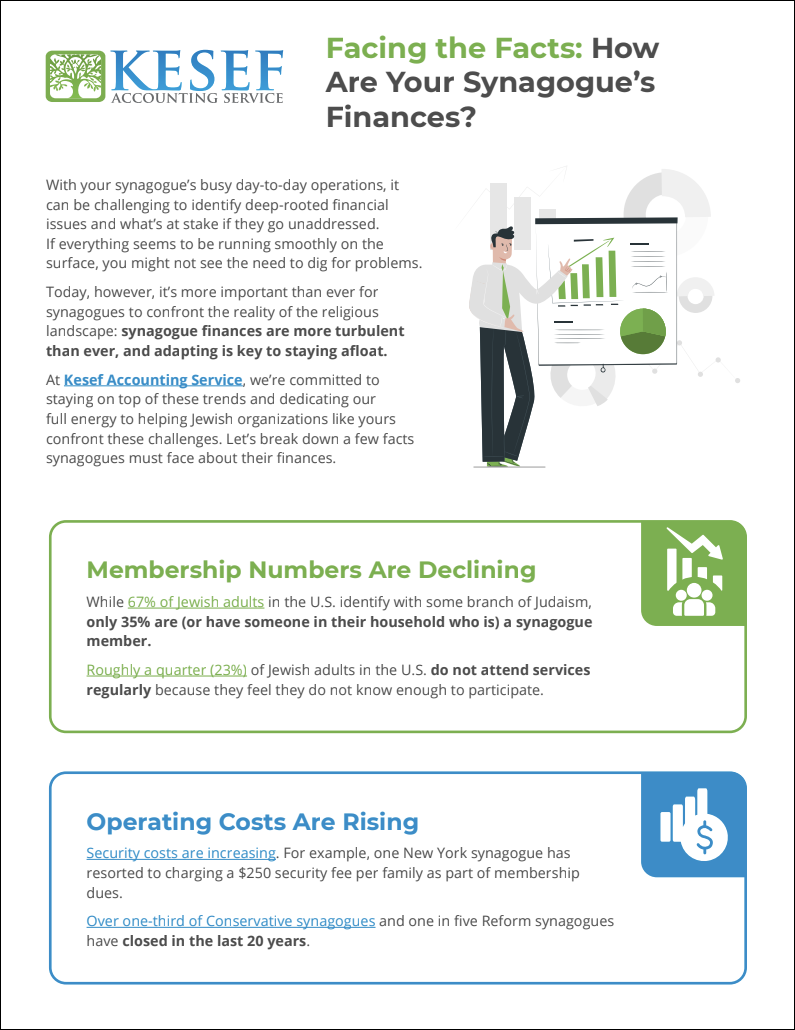
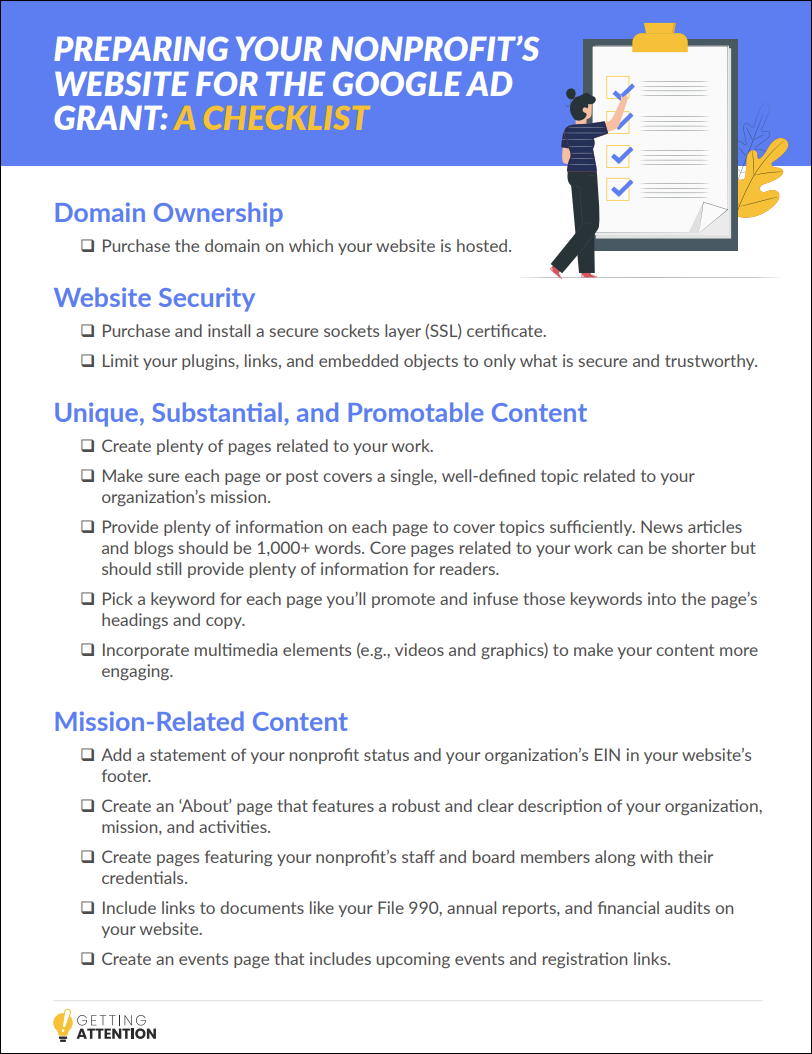
Quick sales enablement graphic
Easily shared with prospects to offer support and build buy-in
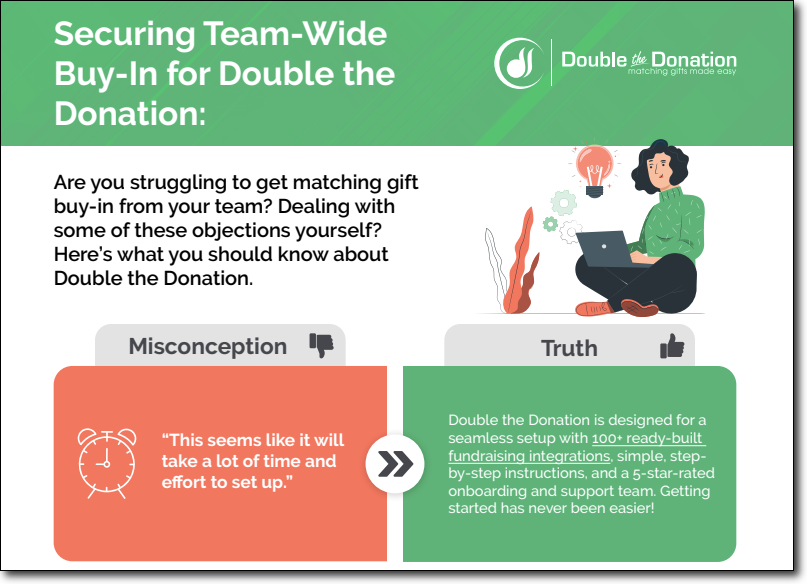
Niche educational resource
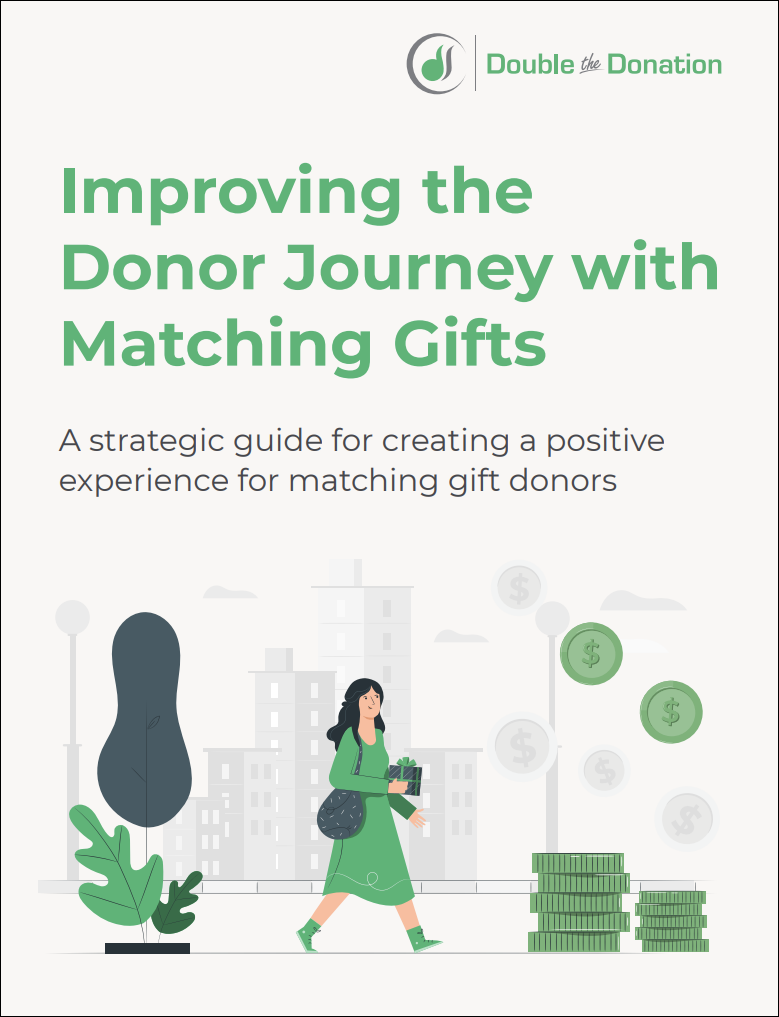
Serves as true thought leadership for the brand while capturing leads
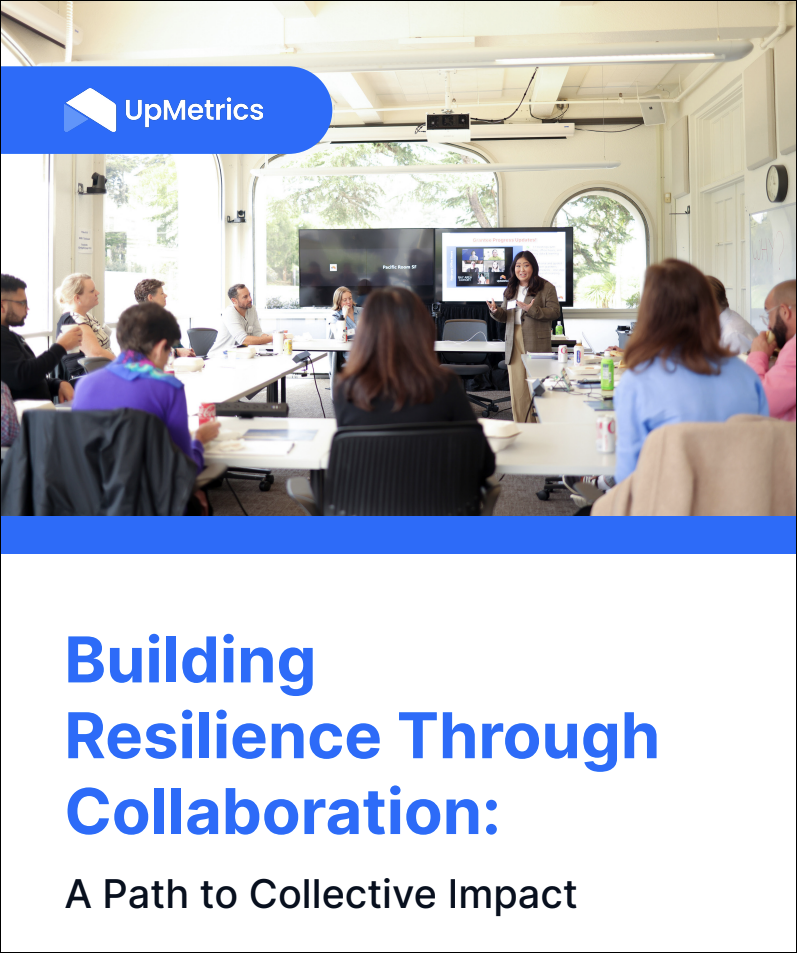
Educational how-to guide
Evergreen, high-value content for lead capture

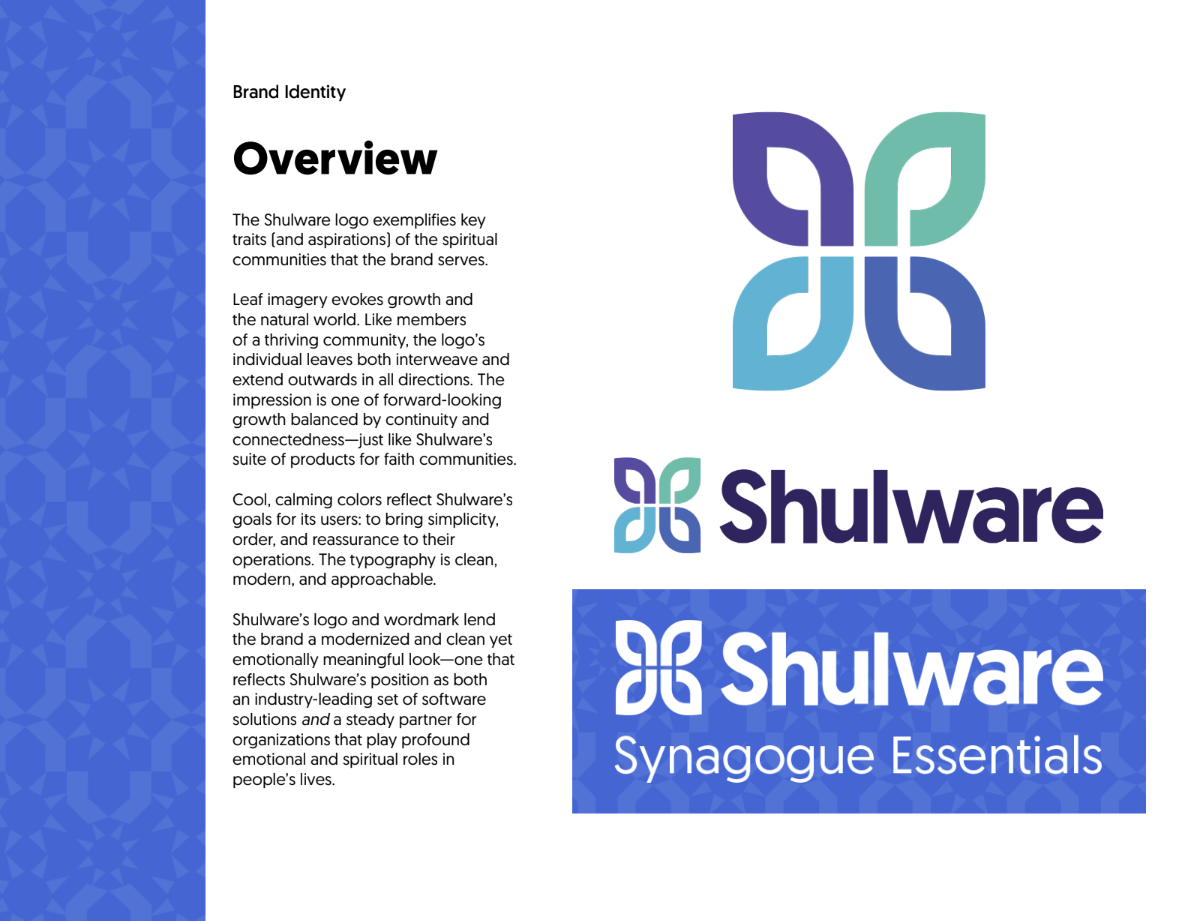
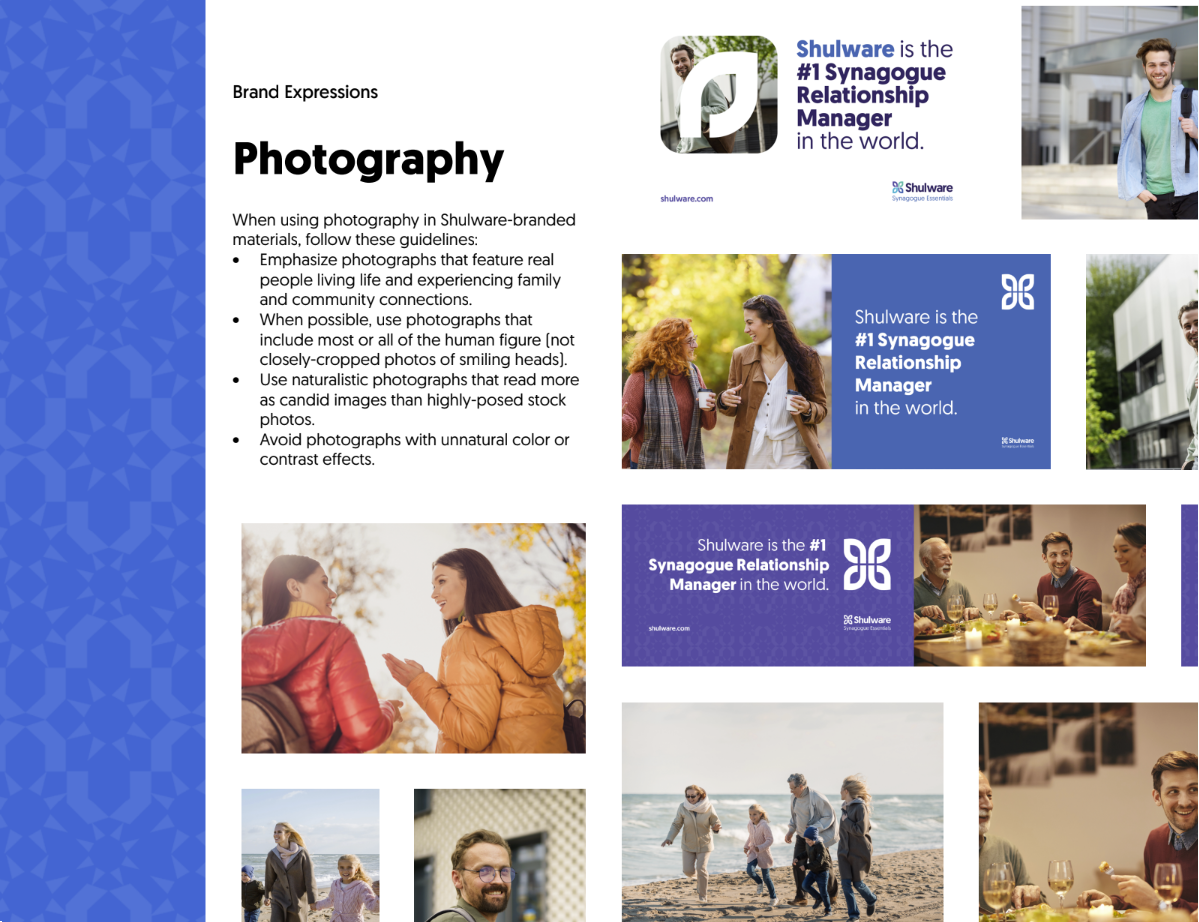
Refreshed brand guidelines
Updated brand assets and comprehensive style guidelines to ensure consistency and impact
Check out more examples of our graphic design work in our portfolio.
Partnering with Nexus for design services
To support your brand’s unique needs, we provide flexible solutions ranging from monthly content engines and on-demand design support to strategic branding.
Whatever design service you need, our goal is to ensure it integrates seamlessly with your current workflows, providing creative expertise and driving your business forward while saving you time.
Take your brand’s design pulse
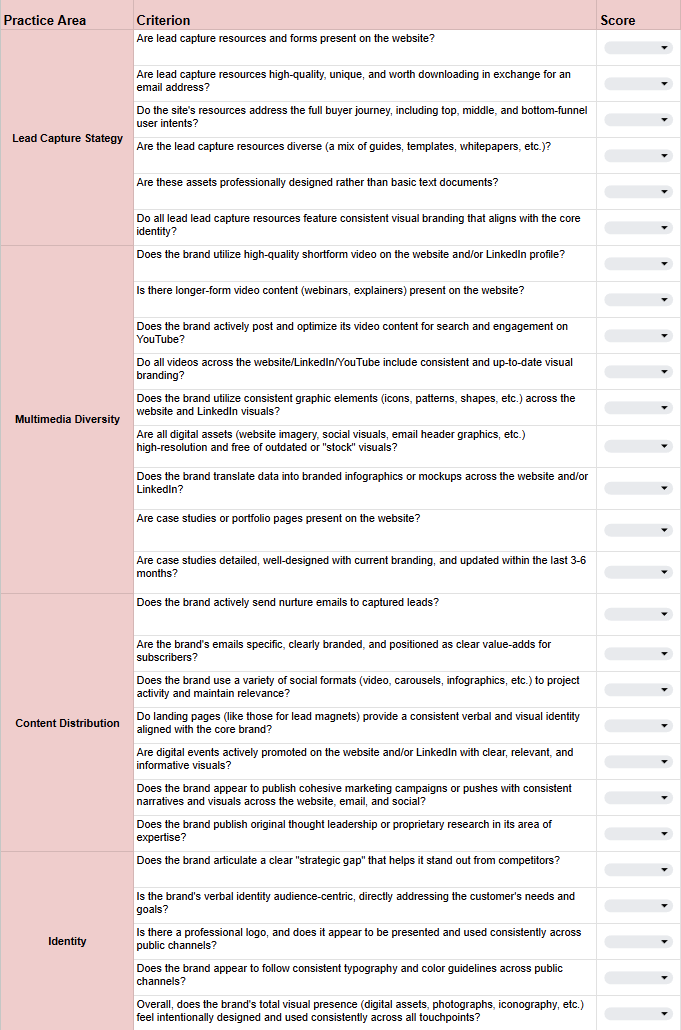
To help clients quickly gauge where they stand with multimedia content and design, we’ve developed a quick scorecard. This tool audits your brand’s:
- Lead capture strategy
- Multimedia diversity
- Content distribution
- Brand identity
Want your score?
Reach out to your Nexus account team to schedule a quick design audit. We can walk through the results and lay out some preliminary recommendations for how to strengthen your brand’s visual presence.
Ready to learn more about how our expanded design capabilities can support your brand? Learn more about our services and let us know if you have any questions.
If you’re already a Nexus client, contact your Account Manager to learn more and discuss your options. If you’re not yet a Nexus client, contact us for a custom consultation.
